XRP Price Restarts Climb: Will Bulls Push It Past $0.60?
XRP price found support near the $0.5600 zone. The price is again rising and might aim for a break above the $0.60 resistance zone. XRP price remained supported near the $0.560 zone. The price is now trading above $0.5750 and the 100-hourly Simple Moving Average. There was a break above a connecting bearish trend line with resistance at $0.5750 on the hourly chart of the XRP/USD pair (data source from Kraken). The pair could gain bullish momentum if it clears the $0.590 and $0.600 resistance levels. XRP Price Regains Strength XRP price started a fresh decline from the $0.5985 zone like Bitcoin and Ethereum. The price declined below the $0.5750 support zone, but the bulls were active near the $0.560 zone. A low was formed at $0.5597 and the price started a fresh upward move, beating BTC and ETH. There was a steady increase above the $0.570 and $0.5720 resistance levels. It cleared the 50% Fib retracement level of the downward move from the $0.5989 swing high to the $0.5597 low. There was a break above a connecting bearish trend line with resistance at $0.5750 on the hourly chart of the XRP/USD pair. The price is now trading above $0.5750 and the 100-hourly Simple Moving Average. On the upside, the price might face resistance near the $0.5890 level. It is close to the 76.4% Fib retracement level of the downward move from the $0.5989 swing high to the $0.5597 low. The first major resistance is near the $0.590 level. The next key resistance could be $0.600. A clear move above the $0.600 resistance might send the price toward the $0.6120 resistance. The next major resistance is near the $0.6250 level. Any more gains might send the price toward the $0.6320 resistance or even $0.6440 in the near term. Another Decline? If XRP fails to clear the $0.590 resistance zone, it could start another decline. Initial support on the downside is near the $0.5765 level. The next major support is $0.5750. If there is a downside break and a close below the $0.5750 level, the price might continue to decline toward the $0.560 support in the near term. The next major support sits at $0.5420. Technical Indicators Hourly MACD – The MACD for XRP/USD is now gaining pace in the bullish zone. Hourly RSI (Relative Strength Index) – The RSI for XRP/USD is now above the 50 level. Major Support Levels – $0.5765 and $0.5600. Major Resistance Levels – $0.5900 and $0.6000.

XRP price found support near the $0.5600 zone. The price is again rising and might aim for a break above the $0.60 resistance zone.
- XRP price remained supported near the $0.560 zone.
- The price is now trading above $0.5750 and the 100-hourly Simple Moving Average.
- There was a break above a connecting bearish trend line with resistance at $0.5750 on the hourly chart of the XRP/USD pair (data source from Kraken).
- The pair could gain bullish momentum if it clears the $0.590 and $0.600 resistance levels.
XRP Price Regains Strength
XRP price started a fresh decline from the $0.5985 zone like Bitcoin and Ethereum. The price declined below the $0.5750 support zone, but the bulls were active near the $0.560 zone.
A low was formed at $0.5597 and the price started a fresh upward move, beating BTC and ETH. There was a steady increase above the $0.570 and $0.5720 resistance levels. It cleared the 50% Fib retracement level of the downward move from the $0.5989 swing high to the $0.5597 low.
There was a break above a connecting bearish trend line with resistance at $0.5750 on the hourly chart of the XRP/USD pair. The price is now trading above $0.5750 and the 100-hourly Simple Moving Average.
On the upside, the price might face resistance near the $0.5890 level. It is close to the 76.4% Fib retracement level of the downward move from the $0.5989 swing high to the $0.5597 low. The first major resistance is near the $0.590 level.
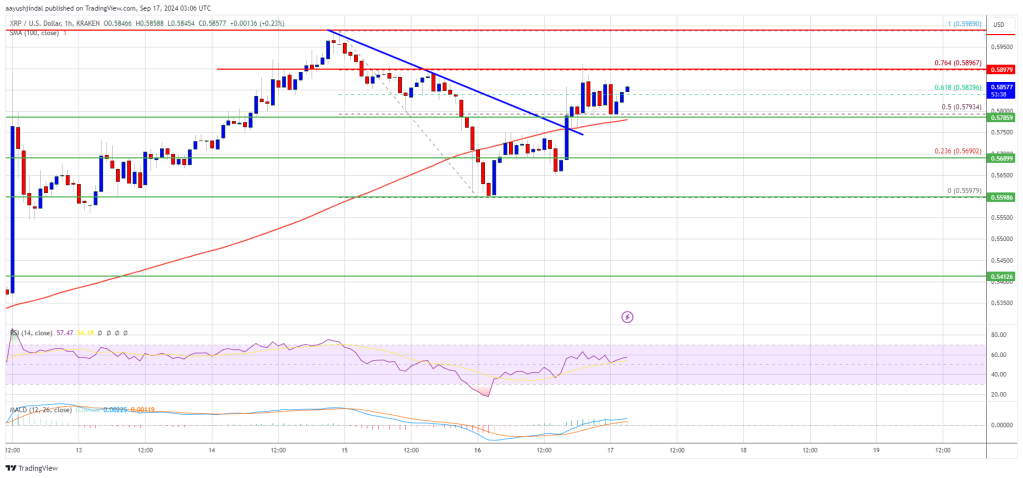
The next key resistance could be $0.600. A clear move above the $0.600 resistance might send the price toward the $0.6120 resistance. The next major resistance is near the $0.6250 level. Any more gains might send the price toward the $0.6320 resistance or even $0.6440 in the near term.
Another Decline?
If XRP fails to clear the $0.590 resistance zone, it could start another decline. Initial support on the downside is near the $0.5765 level. The next major support is $0.5750.
If there is a downside break and a close below the $0.5750 level, the price might continue to decline toward the $0.560 support in the near term. The next major support sits at $0.5420.
Technical Indicators
Hourly MACD – The MACD for XRP/USD is now gaining pace in the bullish zone.
Hourly RSI (Relative Strength Index) – The RSI for XRP/USD is now above the 50 level.
Major Support Levels – $0.5765 and $0.5600.
Major Resistance Levels – $0.5900 and $0.6000.
What's Your Reaction?