Solana Price (SOL) Consolidates: Time for a Fresh Comeback?
Solana declined and tested the $128 support zone. SOL price is consolidating losses and might aim for a fresh increase above the $132 resistance. SOL price started a consolidation phase from the $128 zone against the US Dollar. The price is now trading below $135 and the 100-hourly simple moving average. There is a connecting bearish trend line forming with resistance at $132 on the hourly chart of the SOL/USD pair (data source from Kraken). The pair could gain bullish momentum if it clears the $132 resistance zone. Solana Price Holds Support Solana price started a fresh decline from the $140 resistance zone like Bitcoin and Ethereum. SOL declined below the $135 and $132 support levels. It even tested $128. A low was formed at $128.85 and the price is now consolidating losses. There was a minor increase above the $130 level. The price even tested the 23.6% Fib retracement level of the downward move from the $139.83 swing high to the $128.85 low. Solana is now trading below $132 and the 100-hourly simple moving average. There is also a connecting bearish trend line forming with resistance at $132 on the hourly chart of the SOL/USD pair. On the upside, the price is facing resistance near the $132 level. The next major resistance is near the $135 level or the 50% Fib retracement level of the downward move from the $139.83 swing high to the $128.85 low. A successful close above the $132 and $135 resistance levels could set the pace for another steady increase. The next key resistance is near $140. Any more gains might send the price toward the $150 level. More Downsides in SOL? If SOL fails to rise above the $132 resistance, it could start another decline. Initial support on the downside is near the $130 level. The first major support is near the $128 level. A break below the $128 level might send the price toward the $120 zone. If there is a close below the $120 support, the price could decline toward the $110 support in the near term. Technical Indicators Hourly MACD – The MACD for SOL/USD is losing pace in the bearish zone. Hourly Hours RSI (Relative Strength Index) – The RSI for SOL/USD is near the 50 level. Major Support Levels – $130 and $128. Major Resistance Levels – $132 and $135.

Solana declined and tested the $128 support zone. SOL price is consolidating losses and might aim for a fresh increase above the $132 resistance.
- SOL price started a consolidation phase from the $128 zone against the US Dollar.
- The price is now trading below $135 and the 100-hourly simple moving average.
- There is a connecting bearish trend line forming with resistance at $132 on the hourly chart of the SOL/USD pair (data source from Kraken).
- The pair could gain bullish momentum if it clears the $132 resistance zone.
Solana Price Holds Support
Solana price started a fresh decline from the $140 resistance zone like Bitcoin and Ethereum. SOL declined below the $135 and $132 support levels. It even tested $128.
A low was formed at $128.85 and the price is now consolidating losses. There was a minor increase above the $130 level. The price even tested the 23.6% Fib retracement level of the downward move from the $139.83 swing high to the $128.85 low.
Solana is now trading below $132 and the 100-hourly simple moving average. There is also a connecting bearish trend line forming with resistance at $132 on the hourly chart of the SOL/USD pair.
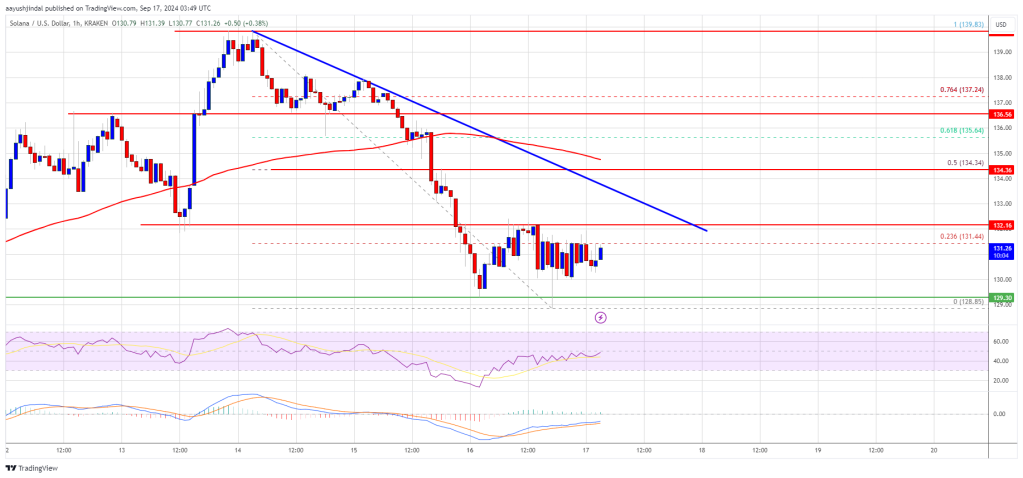
On the upside, the price is facing resistance near the $132 level. The next major resistance is near the $135 level or the 50% Fib retracement level of the downward move from the $139.83 swing high to the $128.85 low. A successful close above the $132 and $135 resistance levels could set the pace for another steady increase. The next key resistance is near $140. Any more gains might send the price toward the $150 level.
More Downsides in SOL?
If SOL fails to rise above the $132 resistance, it could start another decline. Initial support on the downside is near the $130 level. The first major support is near the $128 level.
A break below the $128 level might send the price toward the $120 zone. If there is a close below the $120 support, the price could decline toward the $110 support in the near term.
Technical Indicators
Hourly MACD – The MACD for SOL/USD is losing pace in the bearish zone.
Hourly Hours RSI (Relative Strength Index) – The RSI for SOL/USD is near the 50 level.
Major Support Levels – $130 and $128.
Major Resistance Levels – $132 and $135.
What's Your Reaction?