XRP Price Poised for a Bullish Path Unless This Support Paves Way
XRP price shows positive signs above the $0.4250 support zone. The price could gain bullish momentum if there is a move above the $0.4450 and $0.450 resistance levels. XRP price is attempting a recovery wave above the $0.4250 zone. The price is now trading above $0.4320 and the 100-hourly Simple Moving Average. There is a key rising channel forming with support at $0.4350 on the hourly chart of the XRP/USD pair (data source from Kraken). The pair might gain bullish pace if it clears the $0.4450 and $0.450 resistance levels. XRP Price Eyes Upside Break XRP price remained in a positive zone above the $0.4150 level and extended its recovery wave, like Bitcoin and Ethereum. The price was able to climb above the $0.4250 and $0.4320 resistance levels. The price even cleared the $0.440 level, but it remained below the $0.4450 resistance zone. A high was formed at $0.4430 and the price is now consolidating gains. It is trading above the 23.6% Fib retracement level of the upward move from the $0.4204 swing low to the $0.4430 high. The price is also trading above $0.4320 and the 100-hourly Simple Moving Average. Besides, there is a key rising channel forming with support at $0.4350 on the hourly chart of the XRP/USD pair. On the upside, the price is facing resistance near the $0.4450 level. The first major resistance is near the $0.4500 level. The next key resistance could be $0.4550. A clear move above the $0.4550 resistance might send the price toward the $0.4680 resistance. The next major resistance is near the $0.4720 level. Any more gains might send the price toward the $0.480 resistance. Fresh Decline? If XRP fails to clear the $0.4450 resistance zone, it could start another decline. Initial support on the downside is near the $0.4350 level and the channel trend line. The next major support is at $0.4310 and the 50% Fib retracement level of the upward move from the $0.4204 swing low to the $0.4430 high. If there is a downside break and a close below the $0.4310 level, the price might continue to decline toward the $0.420 support in the near term. Technical Indicators Hourly MACD – The MACD for XRP/USD is now gaining pace in the bullish zone. Hourly RSI (Relative Strength Index) – The RSI for XRP/USD is now above the 50 level. Major Support Levels – $0.4310 and $0.4200. Major Resistance Levels – $0.4450 and $0.4500.

XRP price shows positive signs above the $0.4250 support zone. The price could gain bullish momentum if there is a move above the $0.4450 and $0.450 resistance levels.
- XRP price is attempting a recovery wave above the $0.4250 zone.
- The price is now trading above $0.4320 and the 100-hourly Simple Moving Average.
- There is a key rising channel forming with support at $0.4350 on the hourly chart of the XRP/USD pair (data source from Kraken).
- The pair might gain bullish pace if it clears the $0.4450 and $0.450 resistance levels.
XRP Price Eyes Upside Break
XRP price remained in a positive zone above the $0.4150 level and extended its recovery wave, like Bitcoin and Ethereum. The price was able to climb above the $0.4250 and $0.4320 resistance levels.
The price even cleared the $0.440 level, but it remained below the $0.4450 resistance zone. A high was formed at $0.4430 and the price is now consolidating gains. It is trading above the 23.6% Fib retracement level of the upward move from the $0.4204 swing low to the $0.4430 high.
The price is also trading above $0.4320 and the 100-hourly Simple Moving Average. Besides, there is a key rising channel forming with support at $0.4350 on the hourly chart of the XRP/USD pair.
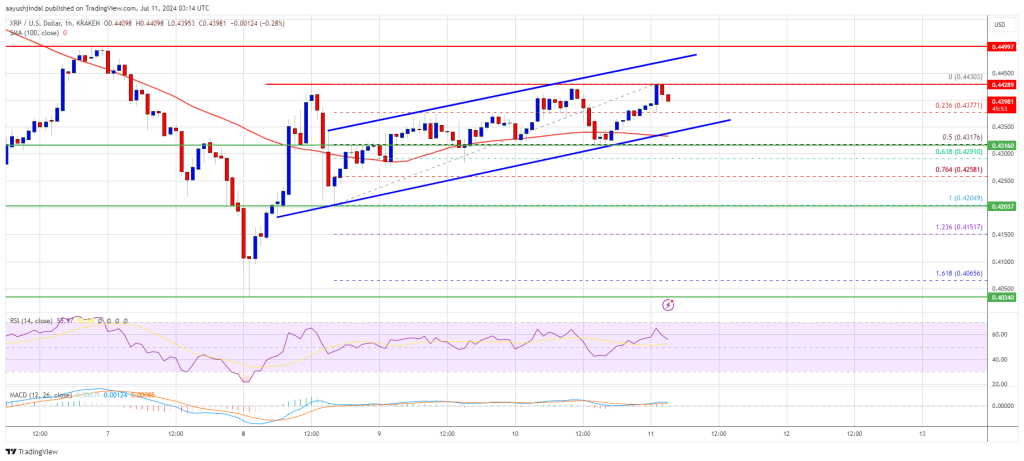
On the upside, the price is facing resistance near the $0.4450 level. The first major resistance is near the $0.4500 level. The next key resistance could be $0.4550. A clear move above the $0.4550 resistance might send the price toward the $0.4680 resistance. The next major resistance is near the $0.4720 level. Any more gains might send the price toward the $0.480 resistance.
Fresh Decline?
If XRP fails to clear the $0.4450 resistance zone, it could start another decline. Initial support on the downside is near the $0.4350 level and the channel trend line.
The next major support is at $0.4310 and the 50% Fib retracement level of the upward move from the $0.4204 swing low to the $0.4430 high. If there is a downside break and a close below the $0.4310 level, the price might continue to decline toward the $0.420 support in the near term.
Technical Indicators
Hourly MACD – The MACD for XRP/USD is now gaining pace in the bullish zone.
Hourly RSI (Relative Strength Index) – The RSI for XRP/USD is now above the 50 level.
Major Support Levels – $0.4310 and $0.4200.
Major Resistance Levels – $0.4450 and $0.4500.
What's Your Reaction?