BNB Price Steadies Above Support: Is a Bullish Comeback on the Horizon?
BNB price started a recovery wave above the $500 resistance. The price is now consolidating and might aim for more gains above $530. BNB price started a decent upward move from the $472 support zone. The price is now trading above $500 and the 100-hourly simple moving average. There is a key rising channel forming with support at $518 on the hourly chart of the BNB/USD pair (data source from Binance). The pair could extend its recovery wave if it clears the $530 resistance in the near term. BNB Price Starts Recovery In the past few days, BNB price saw a decent recovery wave from the $472 support zone, like Ethereum and Bitcoin. The price was able to climb above the $495 and $500 resistance levels. It even cleared the $520 resistance, but the bears were active near the $530 zone. A high was formed at $529.2 and the price is now consolidating gains. It is trading above the 23.6% Fib retracement level of the upward move from the $471 swing low to the $529 high. The price is now trading above $520 and the 100-hourly simple moving average. There is also a key rising channel forming with support at $518 on the hourly chart of the BNB/USD pair. If there is another recovery wave, the price could face resistance near the $530 level. The next resistance sits near the $542 level. A clear move above the $542 zone could send the price higher. In the stated case, BNB price could test $550. A close above the $550 resistance might set the pace for a larger increase toward the $565 resistance. Any more gains might call for a test of the $580 level in the coming days. Another Decline? If BNB fails to clear the $530 resistance, it could start a fresh decline. Initial support on the downside is near the $520 level or the channel trend line. The next major support is near the $508 level. The main support sits at $500 and the 50% Fib retracement level of the upward move from the $471 swing low to the $529 high. If there is a downside break below the $500 support, the price could drop toward the $485 support. Any more losses could initiate a larger decline toward the $472 level. Technical Indicators Hourly MACD – The MACD for BNB/USD is losing pace in the bullish zone. Hourly RSI (Relative Strength Index) – The RSI for BNB/USD is currently near the 50 level. Major Support Levels – $520 and $500. Major Resistance Levels – $530 and $542.

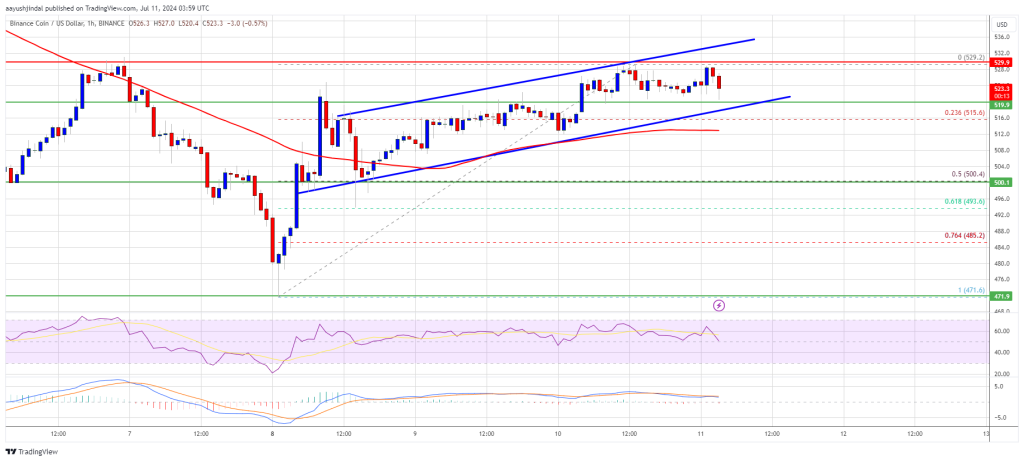
BNB price started a recovery wave above the $500 resistance. The price is now consolidating and might aim for more gains above $530.
- BNB price started a decent upward move from the $472 support zone.
- The price is now trading above $500 and the 100-hourly simple moving average.
- There is a key rising channel forming with support at $518 on the hourly chart of the BNB/USD pair (data source from Binance).
- The pair could extend its recovery wave if it clears the $530 resistance in the near term.
BNB Price Starts Recovery
In the past few days, BNB price saw a decent recovery wave from the $472 support zone, like Ethereum and Bitcoin. The price was able to climb above the $495 and $500 resistance levels.
It even cleared the $520 resistance, but the bears were active near the $530 zone. A high was formed at $529.2 and the price is now consolidating gains. It is trading above the 23.6% Fib retracement level of the upward move from the $471 swing low to the $529 high.
The price is now trading above $520 and the 100-hourly simple moving average. There is also a key rising channel forming with support at $518 on the hourly chart of the BNB/USD pair.
If there is another recovery wave, the price could face resistance near the $530 level. The next resistance sits near the $542 level. A clear move above the $542 zone could send the price higher. In the stated case, BNB price could test $550.
A close above the $550 resistance might set the pace for a larger increase toward the $565 resistance. Any more gains might call for a test of the $580 level in the coming days.
Another Decline?
If BNB fails to clear the $530 resistance, it could start a fresh decline. Initial support on the downside is near the $520 level or the channel trend line.
The next major support is near the $508 level. The main support sits at $500 and the 50% Fib retracement level of the upward move from the $471 swing low to the $529 high. If there is a downside break below the $500 support, the price could drop toward the $485 support. Any more losses could initiate a larger decline toward the $472 level.
Technical Indicators
Hourly MACD – The MACD for BNB/USD is losing pace in the bullish zone.
Hourly RSI (Relative Strength Index) – The RSI for BNB/USD is currently near the 50 level.
Major Support Levels – $520 and $500.
Major Resistance Levels – $530 and $542.
What's Your Reaction?