XRP Price Struggles at Resistance: Will Bulls Power a Fresh Upsurge?
XRP price is consolidating above the $0.5450 support. The price must clear the $0.5800 resistance to start a fresh increase in the near term. XRP price is attempting a fresh increase above the $0.5650 level. The price is now trading below $0.580 and the 100-hourly Simple Moving Average. There is a key bearish trend line forming with resistance at $0.570 on the hourly chart of the XRP/USD pair (data source from Kraken). The pair could start a fresh increase if it clears the $0.580 resistance zone. XRP Price Eyes Breakout XRP price extended losses and even spiked below the $0.550 support zone. It tested the $0.5450 level. A low is formed at $0.5457 and the price is now attempting a fresh increase, like Bitcoin and Ethereum. There was a move above the $0.5550 and $0.5600 levels. The price climbed above the 50% Fib retracement level of the downward move from the $0.6020 swing high to the $0.5457 low. However, the bears are active near the $0.580 resistance zone. There is also a key bearish trend line forming with resistance at $0.570 on the hourly chart of the XRP/USD pair. The price is now trading below $0.570 and the 100-hourly Simple Moving Average. On the upside, the price is facing hurdles near the $0.570 level. The first major resistance is near the $0.580 level. It is close to the 61.8% Fib retracement level of the downward move from the $0.6020 swing high to the $0.5457 low. The next key resistance could be $0.5850. A clear move above the $0.5850 resistance might send the price toward the $0.6050 resistance. The next major resistance is near the $0.6200 level. Any more gains might send the price toward the $0.6320 resistance or even $0.650 in the near term. Another Drop? If XRP fails to clear the $0.580 resistance zone, it could start another decline. Initial support on the downside is near the $0.5580 level. The next major support is at $0.5450. If there is a downside break and a close below the $0.5450 level, the price might continue to decline toward the $0.5320 support. The next major support sits at $0.5250. Technical Indicators Hourly MACD – The MACD for XRP/USD is now losing pace in the bearish zone. Hourly RSI (Relative Strength Index) – The RSI for XRP/USD is now near the 50 level. Major Support Levels – $0.5580 and $0.5450. Major Resistance Levels – $0.5700 and $0.5800.
XRP price is consolidating above the $0.5450 support. The price must clear the $0.5800 resistance to start a fresh increase in the near term.
- XRP price is attempting a fresh increase above the $0.5650 level.
- The price is now trading below $0.580 and the 100-hourly Simple Moving Average.
- There is a key bearish trend line forming with resistance at $0.570 on the hourly chart of the XRP/USD pair (data source from Kraken).
- The pair could start a fresh increase if it clears the $0.580 resistance zone.
XRP Price Eyes Breakout
XRP price extended losses and even spiked below the $0.550 support zone. It tested the $0.5450 level. A low is formed at $0.5457 and the price is now attempting a fresh increase, like Bitcoin and Ethereum.
There was a move above the $0.5550 and $0.5600 levels. The price climbed above the 50% Fib retracement level of the downward move from the $0.6020 swing high to the $0.5457 low. However, the bears are active near the $0.580 resistance zone.
There is also a key bearish trend line forming with resistance at $0.570 on the hourly chart of the XRP/USD pair. The price is now trading below $0.570 and the 100-hourly Simple Moving Average.
On the upside, the price is facing hurdles near the $0.570 level. The first major resistance is near the $0.580 level. It is close to the 61.8% Fib retracement level of the downward move from the $0.6020 swing high to the $0.5457 low.
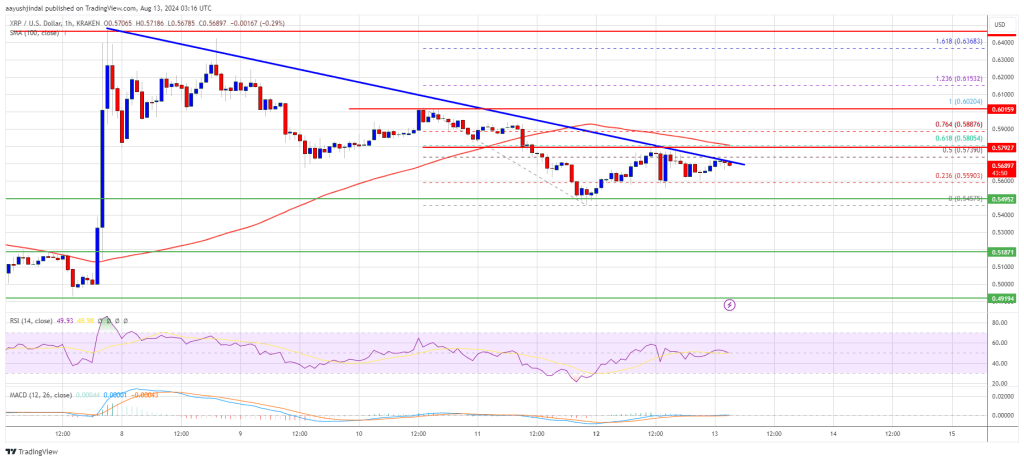
The next key resistance could be $0.5850. A clear move above the $0.5850 resistance might send the price toward the $0.6050 resistance. The next major resistance is near the $0.6200 level. Any more gains might send the price toward the $0.6320 resistance or even $0.650 in the near term.
Another Drop?
If XRP fails to clear the $0.580 resistance zone, it could start another decline. Initial support on the downside is near the $0.5580 level. The next major support is at $0.5450.
If there is a downside break and a close below the $0.5450 level, the price might continue to decline toward the $0.5320 support. The next major support sits at $0.5250.
Technical Indicators
Hourly MACD – The MACD for XRP/USD is now losing pace in the bearish zone.
Hourly RSI (Relative Strength Index) – The RSI for XRP/USD is now near the 50 level.
Major Support Levels – $0.5580 and $0.5450.
Major Resistance Levels – $0.5700 and $0.5800.
What's Your Reaction?