XRP Price Set For Comeback: Breaking This Resistance Could Trigger Recovery
XRP price is consolidating above the $0.420 support zone. The price could gain bullish momentum if there is a move above the $0.440 and $0.4450 resistance levels. XRP price is attempting a recovery wave above the $0.4220 zone. The price is now trading above $0.430 and the 100-hourly Simple Moving Average. There is a short-term contracting triangle forming with resistance at $0.4370 on the hourly chart of the XRP/USD pair (data source from Kraken). The pair might start a decent upward move if it clears the $0.440 and $0.450 resistance levels. XRP Price Aims Higher XRP price formed a base above the $0.4050 level and recently started a recovery wave, like Bitcoin and Ethereum. The price was able to climb above the $0.420 and $0.4250 resistance levels. The bulls were able to push the price above the 61.8% Fib retracement level of the downward move from the $0.4500 swing high to the $0.4035 low. However, the bears seem to be active near the $0.4380 and $0.440 levels. There is also a short-term contracting triangle forming with resistance at $0.4370 on the hourly chart of the XRP/USD pair. The pair is now trading above $0.4270 and the 100-hourly Simple Moving Average. On the upside, the price is facing resistance near the $0.4370 level. The first major resistance is near the $0.4400 level or the 76.4% Fib retracement level of the downward move from the $0.4500 swing high to the $0.4035 low. The next key resistance could be $0.450. A clear move above the $0.450 resistance might send the price toward the $0.4720 resistance. The next major resistance is near the $0.480 level. Any more gains might send the price toward the $0.4880 resistance. Another Drop? If XRP fails to clear the $0.440 resistance zone, it could start another decline. Initial support on the downside is near the $0.4320 level. The next major support is at $0.420. If there is a downside break and a close below the $0.420 level, the price might continue to decline toward the $0.4050 support in the near term. Technical Indicators Hourly MACD – The MACD for XRP/USD is now losing pace in the bearish zone. Hourly RSI (Relative Strength Index) – The RSI for XRP/USD is now above the 50 level. Major Support Levels – $0.4200 and $0.4050. Major Resistance Levels – $0.4400 and $0.4500.
XRP price is consolidating above the $0.420 support zone. The price could gain bullish momentum if there is a move above the $0.440 and $0.4450 resistance levels.
- XRP price is attempting a recovery wave above the $0.4220 zone.
- The price is now trading above $0.430 and the 100-hourly Simple Moving Average.
- There is a short-term contracting triangle forming with resistance at $0.4370 on the hourly chart of the XRP/USD pair (data source from Kraken).
- The pair might start a decent upward move if it clears the $0.440 and $0.450 resistance levels.
XRP Price Aims Higher
XRP price formed a base above the $0.4050 level and recently started a recovery wave, like Bitcoin and Ethereum. The price was able to climb above the $0.420 and $0.4250 resistance levels.
The bulls were able to push the price above the 61.8% Fib retracement level of the downward move from the $0.4500 swing high to the $0.4035 low. However, the bears seem to be active near the $0.4380 and $0.440 levels. There is also a short-term contracting triangle forming with resistance at $0.4370 on the hourly chart of the XRP/USD pair.
The pair is now trading above $0.4270 and the 100-hourly Simple Moving Average. On the upside, the price is facing resistance near the $0.4370 level.
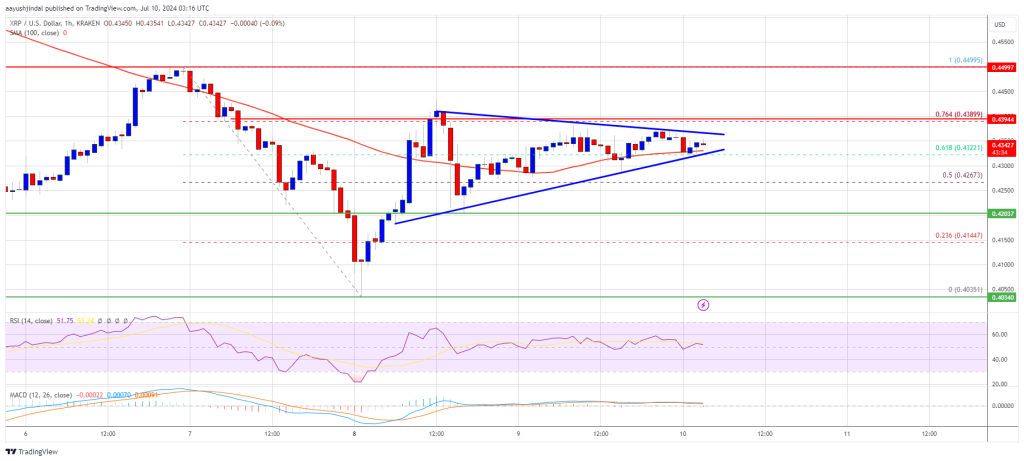
The first major resistance is near the $0.4400 level or the 76.4% Fib retracement level of the downward move from the $0.4500 swing high to the $0.4035 low. The next key resistance could be $0.450. A clear move above the $0.450 resistance might send the price toward the $0.4720 resistance. The next major resistance is near the $0.480 level. Any more gains might send the price toward the $0.4880 resistance.
Another Drop?
If XRP fails to clear the $0.440 resistance zone, it could start another decline. Initial support on the downside is near the $0.4320 level.
The next major support is at $0.420. If there is a downside break and a close below the $0.420 level, the price might continue to decline toward the $0.4050 support in the near term.
Technical Indicators
Hourly MACD – The MACD for XRP/USD is now losing pace in the bearish zone.
Hourly RSI (Relative Strength Index) – The RSI for XRP/USD is now above the 50 level.
Major Support Levels – $0.4200 and $0.4050.
Major Resistance Levels – $0.4400 and $0.4500.
What's Your Reaction?