XRP Price Reaches Support: Will It Trigger a Turnaround?
XRP price started a downside correction from the $0.6480 resistance. The price is now testing the $0.550 support and might eye a fresh increase. XRP price started a downside correction below the $0.620 and $0.600 levels. The price is now trading below $0.600 and the 100-hourly Simple Moving Average. There is a key bearish trend line forming with resistance at $0.5750 on the hourly chart of the XRP/USD pair (data source from Kraken). The pair could start a fresh increase if it clears the $0.580 resistance zone. XRP Price Hits Key Support XRP price struggled to extend gains above the $0.6450 and $0.650 levels. The price started a downside correction below the $0.600 level like Ethereum and Bitcoin. There was a move below the $0.5850 and $0.580 support levels. The price dipped below the 50% Fib retracement level of the upward wave from the $0.4925 swing low to the $0.6475 high. However, the bulls are now active near the $0.5500 support. The 61.8% Fib retracement level of the upward wave from the $0.4925 swing low to the $0.6475 high is acting as a support. The price is now trading below $0.600 and the 100-hourly Simple Moving Average. On the upside, the price is facing hurdles near the $0.570 level. The first major resistance is near the $0.5750 level. There is also a key bearish trend line forming with resistance at $0.5750 on the hourly chart of the XRP/USD pair. The next key resistance could be $0.580. A clear move above the $0.580 resistance might send the price toward the $0.5950 resistance. The next major resistance is near the $0.600 level. Any more gains might send the price toward the $0.620 resistance or even $0.650 in the near term. More Downsides? If XRP fails to clear the $0.580 resistance zone, it could continue to move down. Initial support on the downside is near the $0.5520 level. The next major support is at $0.550. If there is a downside break and a close below the $0.550 level, the price might continue to decline toward the $0.5320 support. The next major support sits at $0.5250. Technical Indicators Hourly MACD – The MACD for XRP/USD is now gaining pace in the bearish zone. Hourly RSI (Relative Strength Index) – The RSI for XRP/USD is now below the 50 level. Major Support Levels – $0.5550 and $0.5500. Major Resistance Levels – $0.5750 and $0.5800.

XRP price started a downside correction from the $0.6480 resistance. The price is now testing the $0.550 support and might eye a fresh increase.
- XRP price started a downside correction below the $0.620 and $0.600 levels.
- The price is now trading below $0.600 and the 100-hourly Simple Moving Average.
- There is a key bearish trend line forming with resistance at $0.5750 on the hourly chart of the XRP/USD pair (data source from Kraken).
- The pair could start a fresh increase if it clears the $0.580 resistance zone.
XRP Price Hits Key Support
XRP price struggled to extend gains above the $0.6450 and $0.650 levels. The price started a downside correction below the $0.600 level like Ethereum and Bitcoin.
There was a move below the $0.5850 and $0.580 support levels. The price dipped below the 50% Fib retracement level of the upward wave from the $0.4925 swing low to the $0.6475 high. However, the bulls are now active near the $0.5500 support.
The 61.8% Fib retracement level of the upward wave from the $0.4925 swing low to the $0.6475 high is acting as a support. The price is now trading below $0.600 and the 100-hourly Simple Moving Average.
On the upside, the price is facing hurdles near the $0.570 level. The first major resistance is near the $0.5750 level. There is also a key bearish trend line forming with resistance at $0.5750 on the hourly chart of the XRP/USD pair. The next key resistance could be $0.580.
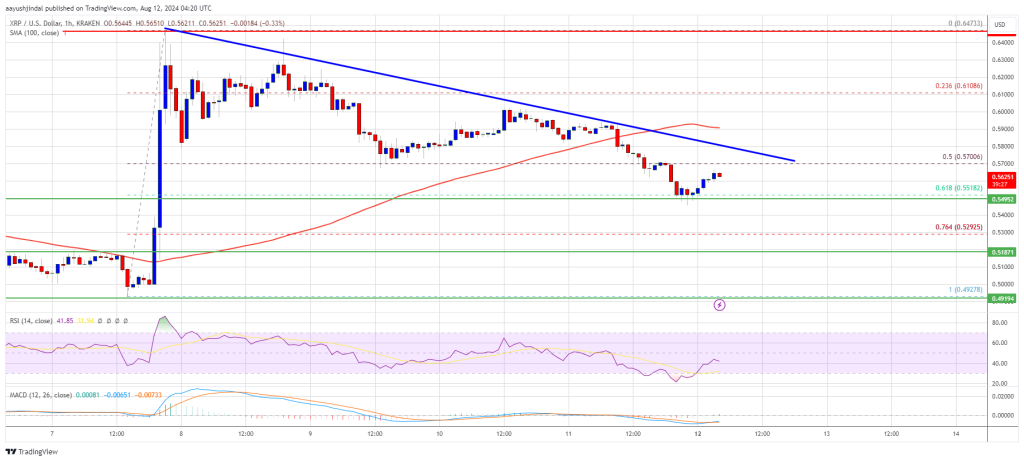
A clear move above the $0.580 resistance might send the price toward the $0.5950 resistance. The next major resistance is near the $0.600 level. Any more gains might send the price toward the $0.620 resistance or even $0.650 in the near term.
More Downsides?
If XRP fails to clear the $0.580 resistance zone, it could continue to move down. Initial support on the downside is near the $0.5520 level. The next major support is at $0.550.
If there is a downside break and a close below the $0.550 level, the price might continue to decline toward the $0.5320 support. The next major support sits at $0.5250.
Technical Indicators
Hourly MACD – The MACD for XRP/USD is now gaining pace in the bearish zone.
Hourly RSI (Relative Strength Index) – The RSI for XRP/USD is now below the 50 level.
Major Support Levels – $0.5550 and $0.5500.
Major Resistance Levels – $0.5750 and $0.5800.
What's Your Reaction?