XRP Price Range-Bound: Can It Maintain Support and Break Out?
XRP price is struggling to clear the $0.6120 resistance zone. The price must stay above the $0.5940 support to attempt another increase in the near term. XRP price is consolidating near the $0.600 support zone. The price is now trading below $0.6120 and the 100-hourly Simple Moving Average. There is a major bullish trend line forming with support at $0.5945 on the hourly chart of the XRP/USD pair (data source from Kraken). The pair could gain bullish momentum if it clears the $0.6120 resistance zone. XRP Price Consolidates Above Key Support XRP price made a couple of attempts to gain strength above $0.6120 and $0.6150. However, the bulls failed to gain strength for a close above $0.6150. There was a bearish reaction, and the price retested the $0.5950 support. A low is formed at $0.5957 and the price is now consolidating, like Ethereum. There is also a major bullish trend line forming with support at $0.5945 on the hourly chart of the XRP/USD pair. The pair is now trading below $0.6120 and the 100-hourly Simple Moving Average. If there is a fresh increase, the price could face resistance near the $0.6025 level or the 50% Fib retracement level of the downward move from the $0.6091 swing high to the $0.5957 low. The first major resistance is near the $0.6060 level or the 76.4% Fib retracement level of the downward move from the $0.6091 swing high to the $0.5957 low. The next key resistance could be $0.6120. A clear move above the $0.6120 resistance might send the price toward the $0.6150 resistance. The next major resistance is near the $0.6200 level. Any more gains might send the price toward the $0.6350 resistance in the near term. More Losses? If XRP fails to clear the $0.6120 resistance zone, it could start another decline. Initial support on the downside is near the $0.5950 level. The next major support is at $0.5880. If there is a downside break and a close below the $0.5880 level, the price might continue to decline toward the $0.5720 support in the near term. The next major support sits at $0.550. Technical Indicators Hourly MACD – The MACD for XRP/USD is now losing pace in the bullish zone. Hourly RSI (Relative Strength Index) – The RSI for XRP/USD is now below the 50 level. Major Support Levels – $0.5950 and $0.5880. Major Resistance Levels – $0.6060 and $0.6120.

XRP price is struggling to clear the $0.6120 resistance zone. The price must stay above the $0.5940 support to attempt another increase in the near term.
- XRP price is consolidating near the $0.600 support zone.
- The price is now trading below $0.6120 and the 100-hourly Simple Moving Average.
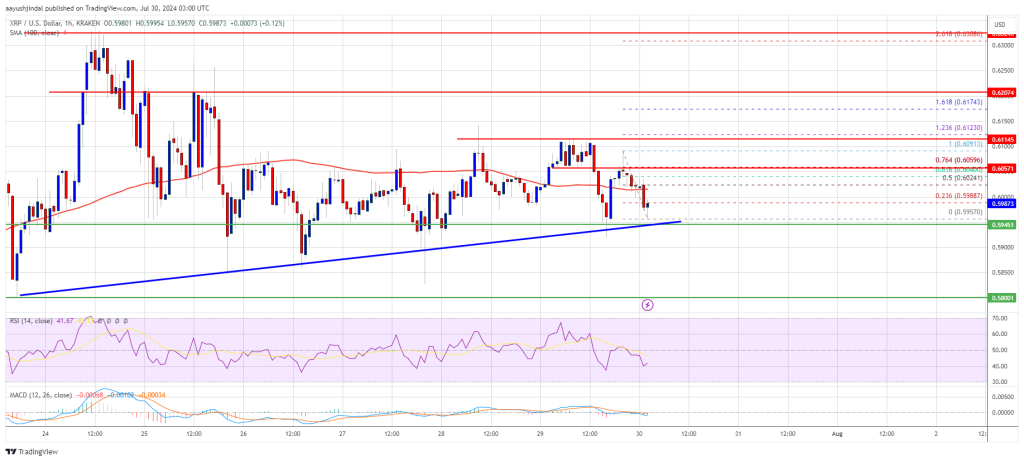
- There is a major bullish trend line forming with support at $0.5945 on the hourly chart of the XRP/USD pair (data source from Kraken).
- The pair could gain bullish momentum if it clears the $0.6120 resistance zone.
XRP Price Consolidates Above Key Support
XRP price made a couple of attempts to gain strength above $0.6120 and $0.6150. However, the bulls failed to gain strength for a close above $0.6150. There was a bearish reaction, and the price retested the $0.5950 support.
A low is formed at $0.5957 and the price is now consolidating, like Ethereum. There is also a major bullish trend line forming with support at $0.5945 on the hourly chart of the XRP/USD pair. The pair is now trading below $0.6120 and the 100-hourly Simple Moving Average.
If there is a fresh increase, the price could face resistance near the $0.6025 level or the 50% Fib retracement level of the downward move from the $0.6091 swing high to the $0.5957 low.
The first major resistance is near the $0.6060 level or the 76.4% Fib retracement level of the downward move from the $0.6091 swing high to the $0.5957 low. The next key resistance could be $0.6120. A clear move above the $0.6120 resistance might send the price toward the $0.6150 resistance.
The next major resistance is near the $0.6200 level. Any more gains might send the price toward the $0.6350 resistance in the near term.
More Losses?
If XRP fails to clear the $0.6120 resistance zone, it could start another decline. Initial support on the downside is near the $0.5950 level. The next major support is at $0.5880.
If there is a downside break and a close below the $0.5880 level, the price might continue to decline toward the $0.5720 support in the near term. The next major support sits at $0.550.
Technical Indicators
Hourly MACD – The MACD for XRP/USD is now losing pace in the bullish zone.
Hourly RSI (Relative Strength Index) – The RSI for XRP/USD is now below the 50 level.
Major Support Levels – $0.5950 and $0.5880.
Major Resistance Levels – $0.6060 and $0.6120.
What's Your Reaction?