XRP Price Hints at Weekly High: Are Bears Ready to Take Over?
XRP price started a downside correction from the $0.6220 zone. The price declined below $0.600 and now consolidating above the $0.580 support. XRP price started a downside correction below the $0.600 zone. The price is now trading near $0.5950 and the 100-hourly Simple Moving Average. There is a connecting bearish trend line forming with resistance at $0.600 on the hourly chart of the XRP/USD pair (data source from Kraken). The pair could continue to rise if it clears the $0.600 resistance zone. XRP Price Corrects Gains XRP price extended its increase above the $0.600 resistance. However, it faced sellers near $0.6220 and recently started a downside correction like Ethereum and Bitcoin. There was a move below the $0.600 and $0.5950 levels. The price even tested $0.580. A low is formed at $0.5802 and the price is now rising. There was a move above the $0.590 level. The price climbed above the 23.6% Fib retracement level of the recent decline from the $0.6232 swing high to the $0.5802 low. The price is now trading near $0.5950 and the 100-hourly Simple Moving Average. If there is a fresh upward move, the price could face resistance near the $0.600 level. There is also a connecting bearish trend line forming with resistance at $0.600 on the hourly chart of the XRP/USD pair. The trend line is close to the 50% Fib retracement level of the recent decline from the $0.6232 swing high to the $0.5802 low. The first major resistance is near the $0.6050 level. The next key resistance could be $0.6220. A clear move above the $0.6220 resistance might send the price toward the $0.6350 resistance. The next major resistance is near the $0.6500 level. Any more gains might send the price toward the $0.680 resistance. More Losses? If XRP fails to clear the $0.600 resistance zone, it could start another decline. Initial support on the downside is near the $0.5850 level. The next major support is at $0.580. If there is a downside break and a close below the $0.580 level, the price might continue to decline toward the $0.550 support in the near term. Technical Indicators Hourly MACD – The MACD for XRP/USD is now gaining pace in the bearish zone. Hourly RSI (Relative Strength Index) – The RSI for XRP/USD is now below the 50 level. Major Support Levels – $0.5850 and $0.5800. Major Resistance Levels – $0.6000 and $0.6050.
XRP price started a downside correction from the $0.6220 zone. The price declined below $0.600 and now consolidating above the $0.580 support.
- XRP price started a downside correction below the $0.600 zone.
- The price is now trading near $0.5950 and the 100-hourly Simple Moving Average.
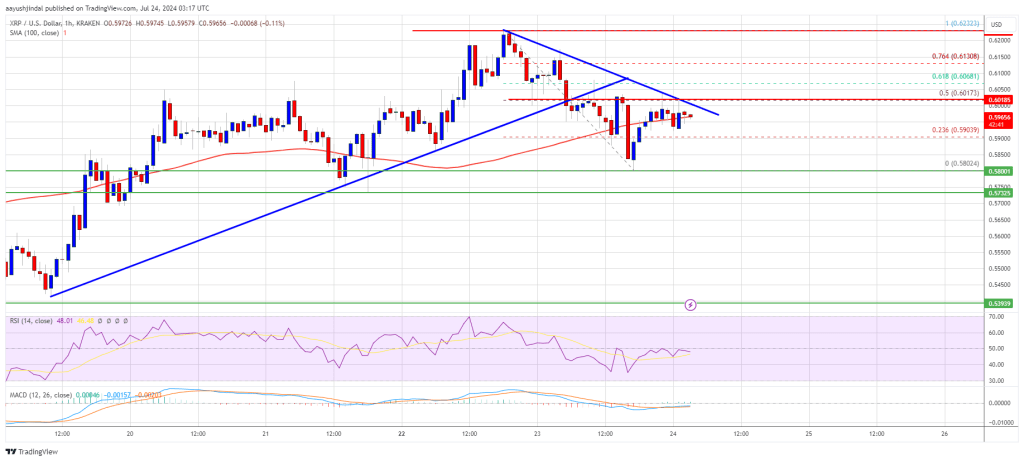
- There is a connecting bearish trend line forming with resistance at $0.600 on the hourly chart of the XRP/USD pair (data source from Kraken).
- The pair could continue to rise if it clears the $0.600 resistance zone.
XRP Price Corrects Gains
XRP price extended its increase above the $0.600 resistance. However, it faced sellers near $0.6220 and recently started a downside correction like Ethereum and Bitcoin. There was a move below the $0.600 and $0.5950 levels.
The price even tested $0.580. A low is formed at $0.5802 and the price is now rising. There was a move above the $0.590 level. The price climbed above the 23.6% Fib retracement level of the recent decline from the $0.6232 swing high to the $0.5802 low.
The price is now trading near $0.5950 and the 100-hourly Simple Moving Average. If there is a fresh upward move, the price could face resistance near the $0.600 level. There is also a connecting bearish trend line forming with resistance at $0.600 on the hourly chart of the XRP/USD pair.
The trend line is close to the 50% Fib retracement level of the recent decline from the $0.6232 swing high to the $0.5802 low. The first major resistance is near the $0.6050 level.
The next key resistance could be $0.6220. A clear move above the $0.6220 resistance might send the price toward the $0.6350 resistance. The next major resistance is near the $0.6500 level. Any more gains might send the price toward the $0.680 resistance.
More Losses?
If XRP fails to clear the $0.600 resistance zone, it could start another decline. Initial support on the downside is near the $0.5850 level. The next major support is at $0.580.
If there is a downside break and a close below the $0.580 level, the price might continue to decline toward the $0.550 support in the near term.
Technical Indicators
Hourly MACD – The MACD for XRP/USD is now gaining pace in the bearish zone.
Hourly RSI (Relative Strength Index) – The RSI for XRP/USD is now below the 50 level.
Major Support Levels – $0.5850 and $0.5800.
Major Resistance Levels – $0.6000 and $0.6050.
What's Your Reaction?