XRP Price Hints at Breakout: Can It Achieve New Heights?
XRP price is attempting a fresh increase above the $0.600 zone. The price could gain bullish momentum if it clears the $0.6200 resistance level. XRP price is showing positive signs from the $0.600 support zone. The price is now trading above $0.6050 and the 100-hourly Simple Moving Average. There was a break above a key contracting triangle with resistance at $0.6050 on the hourly chart of the XRP/USD pair (data source from Kraken). The pair could gain bullish momentum if it stays above the $0.5940 support zone. XRP Price Eyes Could Gather Pace Toward $0.650 XRP price remained stable above the $0.5920 support zone. A base was formed, and the price recently started an upward move above $0.600. There was a clear move above the $0.6020 resistance zone, but it lagged momentum like Bitcoin and Ethereum. There was a break above a key contracting triangle with resistance at $0.6050 on the hourly chart of the XRP/USD pair. The pair is now testing the 50% Fib retracement level of the downward move from the $0.6321 swing high to the $0.5827 low. It is now trading above $0.6050 and the 100-hourly Simple Moving Average. If there are more upsides, the price could face resistance near the $0.6135 level. The first major resistance is near the $0.6200 level or the 76.4% Fib retracement level of the downward move from the $0.6321 swing high to the $0.5827 low. The next key resistance could be $0.6320. A clear move above the $0.6320 resistance might send the price toward the $0.6465 resistance. The next major resistance is near the $0.6500 level. Any more gains might send the price toward the $0.6750 resistance. Another Pullback? If XRP fails to clear the $0.6200 resistance zone, it could start another decline. Initial support on the downside is near the $0.600 level. The next major support is at $0.5940 and the triangle’s trend line zone. If there is a downside break and a close below the $0.5940 level, the price might continue to decline toward the $0.5820 support in the near term. The next major support sits at $0.5750. Technical Indicators Hourly MACD – The MACD for XRP/USD is now gaining pace in the bullish zone. Hourly RSI (Relative Strength Index) – The RSI for XRP/USD is now near the 50 level. Major Support Levels – $0.6000 and $0.5940. Major Resistance Levels – $0.6075 and $0.6200.

XRP price is attempting a fresh increase above the $0.600 zone. The price could gain bullish momentum if it clears the $0.6200 resistance level.
- XRP price is showing positive signs from the $0.600 support zone.
- The price is now trading above $0.6050 and the 100-hourly Simple Moving Average.
- There was a break above a key contracting triangle with resistance at $0.6050 on the hourly chart of the XRP/USD pair (data source from Kraken).
- The pair could gain bullish momentum if it stays above the $0.5940 support zone.
XRP Price Eyes Could Gather Pace Toward $0.650
XRP price remained stable above the $0.5920 support zone. A base was formed, and the price recently started an upward move above $0.600. There was a clear move above the $0.6020 resistance zone, but it lagged momentum like Bitcoin and Ethereum.
There was a break above a key contracting triangle with resistance at $0.6050 on the hourly chart of the XRP/USD pair. The pair is now testing the 50% Fib retracement level of the downward move from the $0.6321 swing high to the $0.5827 low.
It is now trading above $0.6050 and the 100-hourly Simple Moving Average. If there are more upsides, the price could face resistance near the $0.6135 level. The first major resistance is near the $0.6200 level or the 76.4% Fib retracement level of the downward move from the $0.6321 swing high to the $0.5827 low.
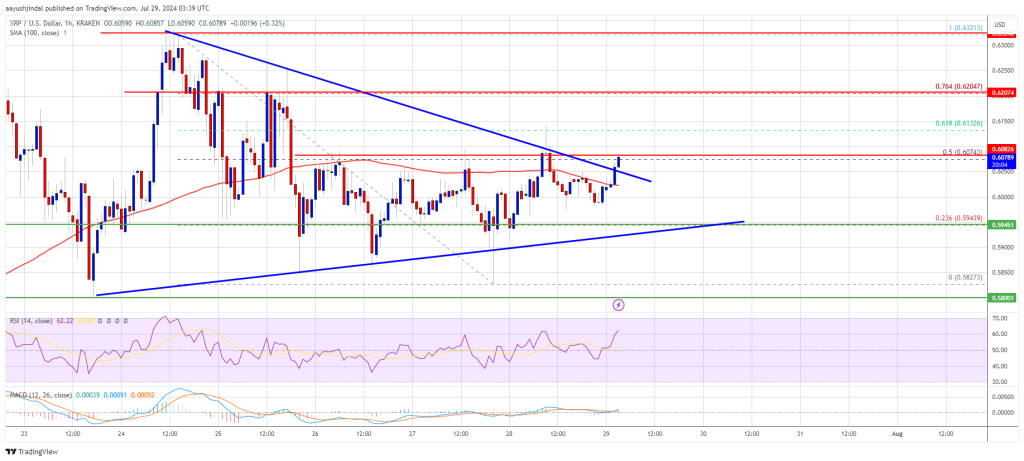
The next key resistance could be $0.6320. A clear move above the $0.6320 resistance might send the price toward the $0.6465 resistance. The next major resistance is near the $0.6500 level. Any more gains might send the price toward the $0.6750 resistance.
Another Pullback?
If XRP fails to clear the $0.6200 resistance zone, it could start another decline. Initial support on the downside is near the $0.600 level. The next major support is at $0.5940 and the triangle’s trend line zone.
If there is a downside break and a close below the $0.5940 level, the price might continue to decline toward the $0.5820 support in the near term. The next major support sits at $0.5750.
Technical Indicators
Hourly MACD – The MACD for XRP/USD is now gaining pace in the bullish zone.
Hourly RSI (Relative Strength Index) – The RSI for XRP/USD is now near the 50 level.
Major Support Levels – $0.6000 and $0.5940.
Major Resistance Levels – $0.6075 and $0.6200.
What's Your Reaction?