XRP Price Finds Relief: Will It Break Past $0.45 Amid Numerous Hurdles?
XRP price is slowly moving higher from the $0.400 support zone. The price is consolidating and might aim for a decent increase above $0.450. XRP price is attempting a recovery wave above the $0.420 zone. The price is now trading above $0.4250 and the 100-hourly Simple Moving Average. There was a break above a connecting bearish trend line with resistance at $0.420 on the hourly chart of the XRP/USD pair (data source from Kraken). The pair might start a decent increase if it clears the $0.4450 and $0.450 resistance levels. XRP Price Eyes Recovery XRP price remained stable above the $0.40 level and recently started a recovery wave, like Bitcoin and Ethereum. The price was able to climb above the $0.4120 and $0.4150 resistance levels. There was a break above a connecting bearish trend line with resistance at $0.420 on the hourly chart of the XRP/USD pair. The pair even spiked above the 61.8% Fib retracement level of the downward move from the $0.4499 swing high to the $0.4035 low. There was a move toward the $0.440 level. The price is now trading above $0.4250 and the 100-hourly Simple Moving Average. On the upside, the price is facing resistance near the $0.4385 level or the 76.4% Fib retracement level of the downward move from the $0.4499 swing high to the $0.4035 low. The first major resistance is near the $0.4450 level. The next key resistance could be $0.450. A clear move above the $0.450 resistance might send the price toward the $0.4650 resistance. The next major resistance is near the $0.4720 level. Any more gains might send the price toward the $0.4840 resistance. Another Decline? If XRP fails to clear the $0.4450 resistance zone, it could start another decline. Initial support on the downside is near the $0.420 level. The next major support is at $0.4050. If there is a downside break and a close below the $0.4050 level, the price might continue to decline toward the $0.3880 support in the near term. Technical Indicators Hourly MACD – The MACD for XRP/USD is now losing pace in the bearish zone. Hourly RSI (Relative Strength Index) – The RSI for XRP/USD is now above the 50 level. Major Support Levels – $0.4200 and $0.4050. Major Resistance Levels – $0.4450 and $0.4500.
XRP price is slowly moving higher from the $0.400 support zone. The price is consolidating and might aim for a decent increase above $0.450.
- XRP price is attempting a recovery wave above the $0.420 zone.
- The price is now trading above $0.4250 and the 100-hourly Simple Moving Average.
- There was a break above a connecting bearish trend line with resistance at $0.420 on the hourly chart of the XRP/USD pair (data source from Kraken).
- The pair might start a decent increase if it clears the $0.4450 and $0.450 resistance levels.
XRP Price Eyes Recovery
XRP price remained stable above the $0.40 level and recently started a recovery wave, like Bitcoin and Ethereum. The price was able to climb above the $0.4120 and $0.4150 resistance levels.
There was a break above a connecting bearish trend line with resistance at $0.420 on the hourly chart of the XRP/USD pair. The pair even spiked above the 61.8% Fib retracement level of the downward move from the $0.4499 swing high to the $0.4035 low.
There was a move toward the $0.440 level. The price is now trading above $0.4250 and the 100-hourly Simple Moving Average. On the upside, the price is facing resistance near the $0.4385 level or the 76.4% Fib retracement level of the downward move from the $0.4499 swing high to the $0.4035 low.
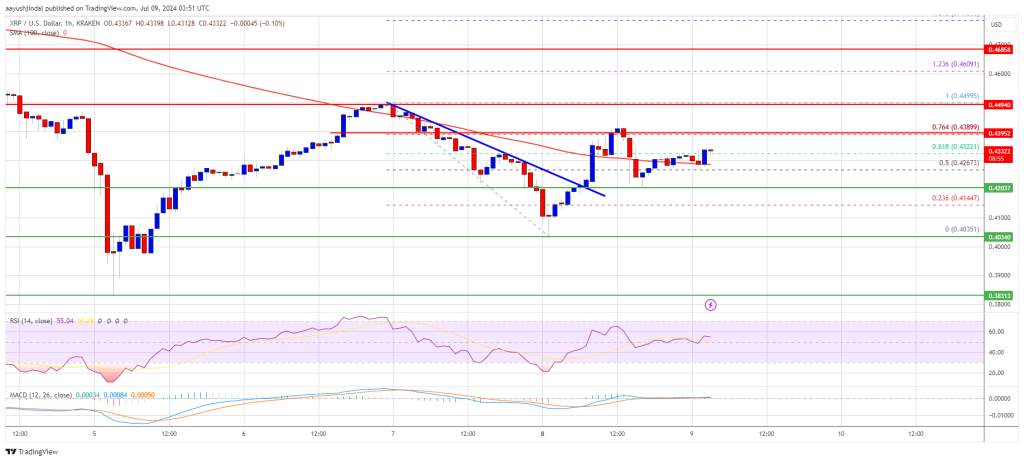
The first major resistance is near the $0.4450 level. The next key resistance could be $0.450. A clear move above the $0.450 resistance might send the price toward the $0.4650 resistance. The next major resistance is near the $0.4720 level. Any more gains might send the price toward the $0.4840 resistance.
Another Decline?
If XRP fails to clear the $0.4450 resistance zone, it could start another decline. Initial support on the downside is near the $0.420 level.
The next major support is at $0.4050. If there is a downside break and a close below the $0.4050 level, the price might continue to decline toward the $0.3880 support in the near term.
Technical Indicators
Hourly MACD – The MACD for XRP/USD is now losing pace in the bearish zone.
Hourly RSI (Relative Strength Index) – The RSI for XRP/USD is now above the 50 level.
Major Support Levels – $0.4200 and $0.4050.
Major Resistance Levels – $0.4450 and $0.4500.
What's Your Reaction?