XRP Price Eyes Breakout: Will It Surge Past Resistance?
XRP price started a recovery wave above the $0.4880 resistance. The price could gain bullish momentum if it clears the $0.5220 resistance. XRP price started a decent recovery wave above the $0.4750 and $0.4880 levels. The price is now trading below $0.5220 and the 100-hourly Simple Moving Average. There was a break above a key bearish trend line with resistance at $0.5040 on the hourly chart of the XRP/USD pair (data source from Kraken). The pair could continue to recover higher if it clears the $0.5220 resistance zone. XRP Price Regains Strength XRP price formed a base above $0.4320 and started a recovery wave like Ethereum and Bitcoin. The price was able to surpass the $0.4750 and $0.4880 resistance levels. There was a move above the 50% Fib retracement level of the downward move from the $0.5767 swing high to the $0.4320 low. Besides, there was a break above a key bearish trend line with resistance at $0.5040 on the hourly chart of the XRP/USD pair. However, the price is facing hurdles near the $0.5200 zone. It is still trading below $0.520 and the 100-hourly Simple Moving Average. On the upside, the price is facing hurdles near the $0.5220 level and the 100-hourly Simple Moving Average. It is close to the 61.8% Fib retracement level of the downward move from the $0.5767 swing high to the $0.4320 low. The first major resistance is near the $0.5420 level. The next key resistance could be $0.5750. A clear move above the $0.5750 resistance might send the price toward the $0.5840 resistance. The next major resistance is near the $0.5920 level. Any more gains might send the price toward the $0.600 resistance or even $0.6120 in the near term. Another Drop? If XRP fails to clear the $0.5220 resistance zone, it could start another decline. Initial support on the downside is near the $0.4980 level. The next major support is at $0.4880. If there is a downside break and a close below the $0.4880 level, the price might continue to decline toward the $0.4660 support in the near term. The next major support sits at $0.4500. Technical Indicators Hourly MACD – The MACD for XRP/USD is now gaining pace in the bullish zone. Hourly RSI (Relative Strength Index) – The RSI for XRP/USD is now above the 50 level. Major Support Levels – $0.4980 and $0.4880. Major Resistance Levels – $0.5220 and $0.5420.

XRP price started a recovery wave above the $0.4880 resistance. The price could gain bullish momentum if it clears the $0.5220 resistance.
- XRP price started a decent recovery wave above the $0.4750 and $0.4880 levels.
- The price is now trading below $0.5220 and the 100-hourly Simple Moving Average.
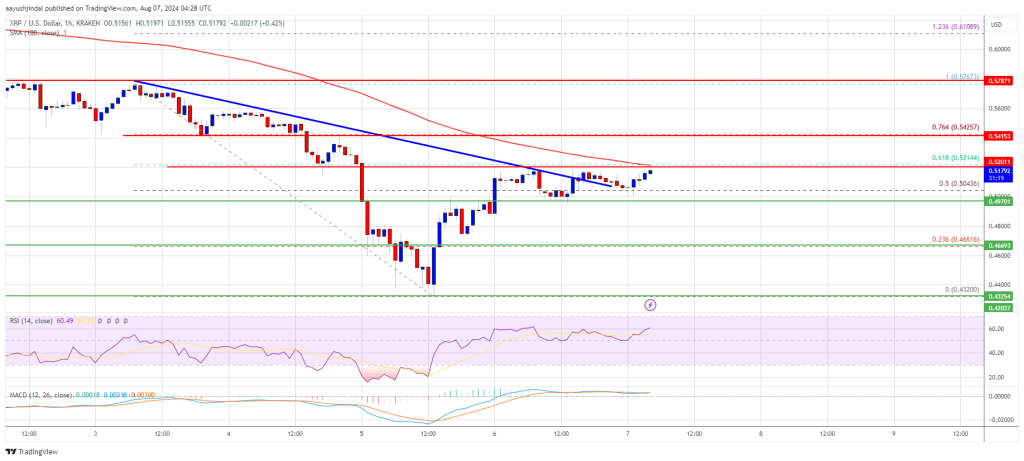
- There was a break above a key bearish trend line with resistance at $0.5040 on the hourly chart of the XRP/USD pair (data source from Kraken).
- The pair could continue to recover higher if it clears the $0.5220 resistance zone.
XRP Price Regains Strength
XRP price formed a base above $0.4320 and started a recovery wave like Ethereum and Bitcoin. The price was able to surpass the $0.4750 and $0.4880 resistance levels.
There was a move above the 50% Fib retracement level of the downward move from the $0.5767 swing high to the $0.4320 low. Besides, there was a break above a key bearish trend line with resistance at $0.5040 on the hourly chart of the XRP/USD pair.
However, the price is facing hurdles near the $0.5200 zone. It is still trading below $0.520 and the 100-hourly Simple Moving Average. On the upside, the price is facing hurdles near the $0.5220 level and the 100-hourly Simple Moving Average. It is close to the 61.8% Fib retracement level of the downward move from the $0.5767 swing high to the $0.4320 low.
The first major resistance is near the $0.5420 level. The next key resistance could be $0.5750. A clear move above the $0.5750 resistance might send the price toward the $0.5840 resistance. The next major resistance is near the $0.5920 level. Any more gains might send the price toward the $0.600 resistance or even $0.6120 in the near term.
Another Drop?
If XRP fails to clear the $0.5220 resistance zone, it could start another decline. Initial support on the downside is near the $0.4980 level. The next major support is at $0.4880.
If there is a downside break and a close below the $0.4880 level, the price might continue to decline toward the $0.4660 support in the near term. The next major support sits at $0.4500.
Technical Indicators
Hourly MACD – The MACD for XRP/USD is now gaining pace in the bullish zone.
Hourly RSI (Relative Strength Index) – The RSI for XRP/USD is now above the 50 level.
Major Support Levels – $0.4980 and $0.4880.
Major Resistance Levels – $0.5220 and $0.5420.
What's Your Reaction?