XLM Price (Stellar) Surges Along XRP, Can Bulls Push It To $0.12?
Stellar (XLM) started a strong increase above the $0.0950 resistance against the US Dollar. XLM price is gaining pace and might aim for $0.120. There was a steady increase in Stellar’s token price above $0.0950 against the US dollar. It is now trading above $0.100 and the 100 hourly simple moving average. There is a major bullish trend line forming with support near $0.0980 on the hourly chart of the XLM/USD pair (data source from Kraken). The pair is likely to continue higher towards $0.1150 and $0.1200 in the near term. Stellar Price Rallies Over 10% After forming a strong support base above $0.0750, Stellar (XLM) saw a strong increase above $0.0850 against the US Dollar, following XRP surge. It gained over 10% beating Bitcoin in the short term. There was a clear move above the $0.0950 and $0.100 resistance levels. The price tested the $0.1050 zone. A high was formed at $0.1043 and the price is now consolidating gains. There was a minor decline below the $0.10 level. The price tested the 23.6% Fib retracement level of the recent increase from the $0.0757 low to the $0.1043 high. XLM price is now trading above the $0.10 resistance and the 100 hourly simple moving average. There is also a major bullish trend line forming with support near $0.0980 on the hourly chart of the XLM/USD pair. On the upside, an immediate resistance is near the $0.1050 level. The next major resistance is near the $0.1120 level, above which the price could test $0.1150. A close above the $0.1150 level might start a steady increase toward the $0.1200 and $0.1250 levels. The next major stop could be $0.1300 or even $0.1320. Are Dips Supported in XLM? If XLM price struggles to continue higher, it could start a downside correction. Immediate support on the downside is near the $0.0980 level or the trend line. The next major support is near the $0.090 level or the 100 hourly SMA. A clear break below the $0.0900 support zone could spark a fresh decline. The next major support on the downside is near the $0.0800 level. Technical Indicators Hourly MACD – The MACD for XLM/USD is gaining pace in the bullish zone. Hourly RSI (Relative Strength Index) – The RSI for XLM/USD is currently well above the 50 level. Major Support Levels – $0.0980 and $0.0900. Major Resistance Levels – $0.1050 and $0.1200.

Stellar (XLM) started a strong increase above the $0.0950 resistance against the US Dollar. XLM price is gaining pace and might aim for $0.120.
- There was a steady increase in Stellar’s token price above $0.0950 against the US dollar.
- It is now trading above $0.100 and the 100 hourly simple moving average.
- There is a major bullish trend line forming with support near $0.0980 on the hourly chart of the XLM/USD pair (data source from Kraken).
- The pair is likely to continue higher towards $0.1150 and $0.1200 in the near term.
Stellar Price Rallies Over 10%
After forming a strong support base above $0.0750, Stellar (XLM) saw a strong increase above $0.0850 against the US Dollar, following XRP surge. It gained over 10% beating Bitcoin in the short term.
There was a clear move above the $0.0950 and $0.100 resistance levels. The price tested the $0.1050 zone. A high was formed at $0.1043 and the price is now consolidating gains. There was a minor decline below the $0.10 level. The price tested the 23.6% Fib retracement level of the recent increase from the $0.0757 low to the $0.1043 high.
XLM price is now trading above the $0.10 resistance and the 100 hourly simple moving average. There is also a major bullish trend line forming with support near $0.0980 on the hourly chart of the XLM/USD pair.
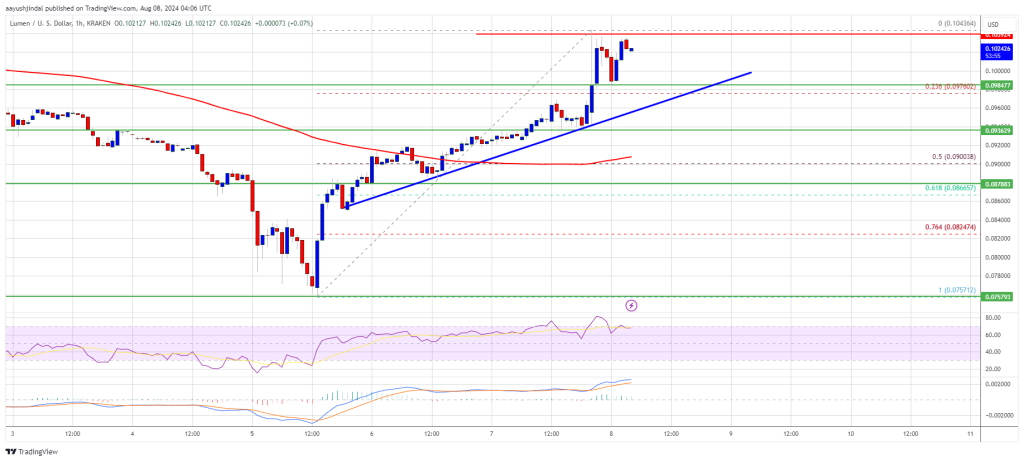
On the upside, an immediate resistance is near the $0.1050 level. The next major resistance is near the $0.1120 level, above which the price could test $0.1150. A close above the $0.1150 level might start a steady increase toward the $0.1200 and $0.1250 levels. The next major stop could be $0.1300 or even $0.1320.
Are Dips Supported in XLM?
If XLM price struggles to continue higher, it could start a downside correction. Immediate support on the downside is near the $0.0980 level or the trend line.
The next major support is near the $0.090 level or the 100 hourly SMA. A clear break below the $0.0900 support zone could spark a fresh decline. The next major support on the downside is near the $0.0800 level.
Technical Indicators
Hourly MACD – The MACD for XLM/USD is gaining pace in the bullish zone.
Hourly RSI (Relative Strength Index) – The RSI for XLM/USD is currently well above the 50 level.
Major Support Levels – $0.0980 and $0.0900.
Major Resistance Levels – $0.1050 and $0.1200.
What's Your Reaction?