Solana Eyes $150 Rebound: SOL Bulls Optimistic With Positive Indicators
Solana started a recovery wave from the $128 zone. SOL price is up over 6% and the bulls seem to be aiming to reclaim the $150 level. SOL price started a decent upward move above the $132 resistance against the US Dollar. The price is now trading above $135 and the 100-hourly simple moving average. There was a break above a key bearish trend line with resistance at $136 on the hourly chart of the SOL/USD pair (data source from Kraken). The pair could continue to rise toward $150 or even $155 in the near term. Solana Price Trims Some Losses Solana price managed to stay above the $120 pivot level. SOL formed a base above the $128 level and recently started a decent recovery wave, outperforming Bitcoin and Ethereum in the past two sessions. There was a move above the $132 and $135 resistance levels. The price cleared the 61.8% Fib retracement level of the downward move from the $144.15 swing high to the $127.88 low. There was also a break above a key bearish trend line with resistance at $136 on the hourly chart of the SOL/USD pair. Solana is now trading above the $135 level and the 100-hourly simple moving average. It is now attempting a close above the 76.4% Fib retracement level of the downward move from the $144.15 swing high to the $127.88 low. On the upside, the price might face resistance near the $144 level. The next major resistance is near the $150 level. A successful close above the $150 resistance could set the pace for another steady increase. The next key resistance is near $155. Any more gains might send the price toward the $162 level. Another Decline in SOL? If SOL fails to rise above the $144 resistance, it could start another decline. Initial support on the downside is near the $136 level and the 100-hourly simple moving average. The first major support is near the $128 level, below which the price could test $120. If there is a close below the $120 support, the price could decline toward the $112 support in the near term. Technical Indicators Hourly MACD – The MACD for SOL/USD is gaining pace in the bullish zone. Hourly Hours RSI (Relative Strength Index) – The RSI for SOL/USD is above the 50 level. Major Support Levels – $136 and $128. Major Resistance Levels – $144 and $150.

Solana started a recovery wave from the $128 zone. SOL price is up over 6% and the bulls seem to be aiming to reclaim the $150 level.
- SOL price started a decent upward move above the $132 resistance against the US Dollar.
- The price is now trading above $135 and the 100-hourly simple moving average.
- There was a break above a key bearish trend line with resistance at $136 on the hourly chart of the SOL/USD pair (data source from Kraken).
- The pair could continue to rise toward $150 or even $155 in the near term.
Solana Price Trims Some Losses
Solana price managed to stay above the $120 pivot level. SOL formed a base above the $128 level and recently started a decent recovery wave, outperforming Bitcoin and Ethereum in the past two sessions.
There was a move above the $132 and $135 resistance levels. The price cleared the 61.8% Fib retracement level of the downward move from the $144.15 swing high to the $127.88 low. There was also a break above a key bearish trend line with resistance at $136 on the hourly chart of the SOL/USD pair.
Solana is now trading above the $135 level and the 100-hourly simple moving average. It is now attempting a close above the 76.4% Fib retracement level of the downward move from the $144.15 swing high to the $127.88 low.
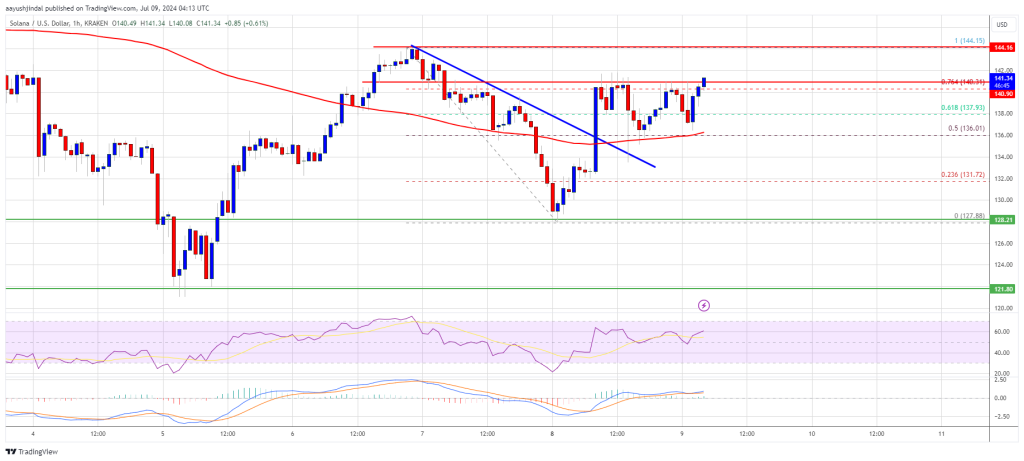
On the upside, the price might face resistance near the $144 level. The next major resistance is near the $150 level. A successful close above the $150 resistance could set the pace for another steady increase. The next key resistance is near $155. Any more gains might send the price toward the $162 level.
Another Decline in SOL?
If SOL fails to rise above the $144 resistance, it could start another decline. Initial support on the downside is near the $136 level and the 100-hourly simple moving average.
The first major support is near the $128 level, below which the price could test $120. If there is a close below the $120 support, the price could decline toward the $112 support in the near term.
Technical Indicators
Hourly MACD – The MACD for SOL/USD is gaining pace in the bullish zone.
Hourly Hours RSI (Relative Strength Index) – The RSI for SOL/USD is above the 50 level.
Major Support Levels – $136 and $128.
Major Resistance Levels – $144 and $150.
What's Your Reaction?