Ethereum Price Support Retest: Is a Double Bottom Pattern Emerging?
Ethereum price declined again and retested the $3,365 support zone. ETH could start a fresh increase toward $3,700 if it stays above $3,365. Ethereum is still holding the key $3,365 support zone. The price is trading below $3,550 and the 100-hourly Simple Moving Average. There is a connecting bearish trend line forming with resistance near $3,500 on the hourly chart of ETH/USD (data feed via Kraken). The pair could form a double-bottom pattern and rise toward the $3,700 resistance. Ethereum Price Retests Key Support Ethereum price failed to gain pace for a move above the $3,580 and $3,650 resistance levels. ETH reacted to the downside like Bitcoin and declined below the $3,500 support. There was a sharp move below $3,420, but the bulls were again active near $3,350. A low was formed near the $3,350 level and the price is again rising. There was a move above the $3,380 and $3,400 resistance levels. The price was able to clear the 23.6% Fib retracement level of the downward move from the $3,649 swing high to the $3,350 low. Ethereum is now trading below $3,550 and the 100-hourly Simple Moving Average. It seems like the price could form a double-bottom pattern and rise toward the $3,700 resistance. If there is a fresh increase, the price might face resistance near the $3,460 level. The first major resistance is near the $3,500 level or the 50% Fib retracement level of the downward move from the $3,649 swing high to the $3,350 low. There is also a connecting bearish trend line forming with resistance near $3,500 on the hourly chart of ETH/USD. An upside break above the $3,500 resistance might send the price higher. The next key resistance sits at $3,580, above which the price might gain traction and rise toward the $3,650 level. A clear move above the $3,650 level might send Ether toward the $3,720 resistance. Any more gains could send Ether toward the $3,800 resistance zone. Downside Break In ETH? If Ethereum fails to clear the $3,500 resistance, it could continue to move down. Initial support on the downside is near $3,380. The first major support is at $3,350. A clear move below the $3,350 support might push the price toward $3,250. Any more losses might send the price toward the $3,120 level in the near term. Technical Indicators Hourly MACD – The MACD for ETH/USD is losing momentum in the bearish zone. Hourly RSI – The RSI for ETH/USD is now below the 50 zone. Major Support Level – $3,350 Major Resistance Level – $3,500
Ethereum price declined again and retested the $3,365 support zone. ETH could start a fresh increase toward $3,700 if it stays above $3,365.
- Ethereum is still holding the key $3,365 support zone.
- The price is trading below $3,550 and the 100-hourly Simple Moving Average.
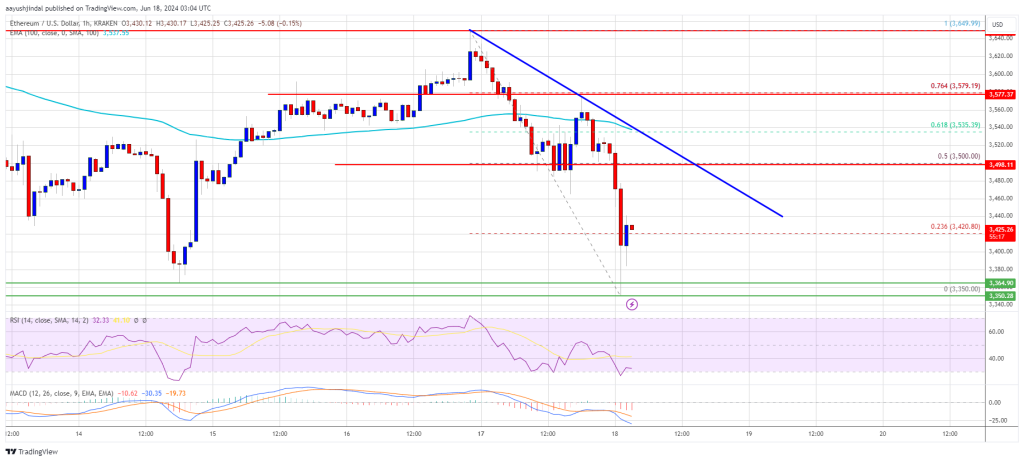
- There is a connecting bearish trend line forming with resistance near $3,500 on the hourly chart of ETH/USD (data feed via Kraken).
- The pair could form a double-bottom pattern and rise toward the $3,700 resistance.
Ethereum Price Retests Key Support
Ethereum price failed to gain pace for a move above the $3,580 and $3,650 resistance levels. ETH reacted to the downside like Bitcoin and declined below the $3,500 support. There was a sharp move below $3,420, but the bulls were again active near $3,350.
A low was formed near the $3,350 level and the price is again rising. There was a move above the $3,380 and $3,400 resistance levels. The price was able to clear the 23.6% Fib retracement level of the downward move from the $3,649 swing high to the $3,350 low.
Ethereum is now trading below $3,550 and the 100-hourly Simple Moving Average. It seems like the price could form a double-bottom pattern and rise toward the $3,700 resistance. If there is a fresh increase, the price might face resistance near the $3,460 level.
The first major resistance is near the $3,500 level or the 50% Fib retracement level of the downward move from the $3,649 swing high to the $3,350 low. There is also a connecting bearish trend line forming with resistance near $3,500 on the hourly chart of ETH/USD.
An upside break above the $3,500 resistance might send the price higher. The next key resistance sits at $3,580, above which the price might gain traction and rise toward the $3,650 level.
A clear move above the $3,650 level might send Ether toward the $3,720 resistance. Any more gains could send Ether toward the $3,800 resistance zone.
Downside Break In ETH?
If Ethereum fails to clear the $3,500 resistance, it could continue to move down. Initial support on the downside is near $3,380. The first major support is at $3,350.
A clear move below the $3,350 support might push the price toward $3,250. Any more losses might send the price toward the $3,120 level in the near term.
Technical Indicators
Hourly MACD – The MACD for ETH/USD is losing momentum in the bearish zone.
Hourly RSI – The RSI for ETH/USD is now below the 50 zone.
Major Support Level – $3,350
Major Resistance Level – $3,500
What's Your Reaction?