
Ethereum Price Struggles to Sustain Gains: Is the Uptrend in Trouble?
Ethereum price struggled to clear the $2,750 resistance. ETH is now consolidating near $2,635 and remains at risk of more downsides. Ethereum started a fresh decline from the $2,750 resistance. The price is trading below $2,700 and the 100-hourly Simple Moving Average. There was a break below a key contracting triangle with support at $2,695 on the hourly chart of ETH/USD (data feed via Kraken). The pair could extend losses if it drops below the $2,635 support zone. Ethereum Price Slides Again Ethereum price started a decent increase from the $2,650 support zone. ETH outperformed Bitcoin and surpassed the $2,720 resistance zone. However, the bears were active near the $2,750 zone. The recent swing high was formed at $2,763 before the price corrected gains. There was a move below the $2,720 and $2,700 levels. Besides, there was a break below a key contracting triangle with support at $2,695 on the hourly chart of ETH/USD. Ethereum price is now trading below $2,700 and the 100-hourly Simple Moving Average. A low is formed near $2,635 and the price is now consolidating. If there is another increase, the price might face hurdles near the $2,700 level. It is close to the 50% Fib retracement level of the recent decline from the $2,763 swing high to the $2,635 low. The first major resistance is near the $2,735 level or the 76.4% Fib retracement level of the recent decline from the $2,763 swing high to the $2,635 low. A close above the $2,735 level might send Ether toward the $2,765 resistance. The next key resistance is near $2,800. An upside break above the $2,800 resistance might send the price higher toward the $2,880 resistance zone in the near term. More Losses In ETH? If Ethereum fails to clear the $2,700 resistance, it could continue to move down. Initial support on the downside is near $2,635. The first major support sits near the $2,600 zone. A clear move below the $2,600 support might push the price toward $2,550. Any more losses might send the price toward the $2,520 support level in the near term. The next key support sits at $2,440. Technical Indicators Hourly MACD – The MACD for ETH/USD is losing momentum in the bullish zone. Hourly RSI – The RSI for ETH/USD is now below the 50 zone. Major Support Level – $2,635 Major Resistance Level – $2,700

Ethereum price struggled to clear the $2,750 resistance. ETH is now consolidating near $2,635 and remains at risk of more downsides.
- Ethereum started a fresh decline from the $2,750 resistance.
- The price is trading below $2,700 and the 100-hourly Simple Moving Average.
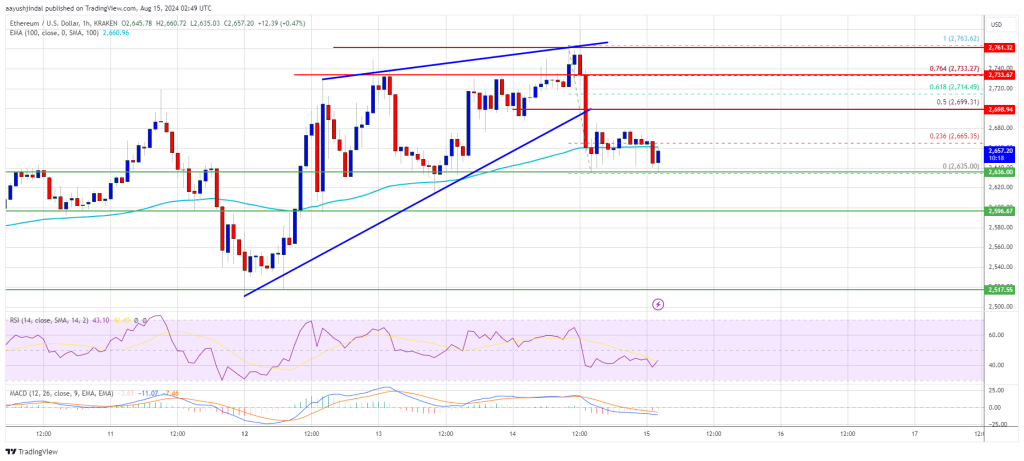
- There was a break below a key contracting triangle with support at $2,695 on the hourly chart of ETH/USD (data feed via Kraken).
- The pair could extend losses if it drops below the $2,635 support zone.
Ethereum Price Slides Again
Ethereum price started a decent increase from the $2,650 support zone. ETH outperformed Bitcoin and surpassed the $2,720 resistance zone. However, the bears were active near the $2,750 zone.
The recent swing high was formed at $2,763 before the price corrected gains. There was a move below the $2,720 and $2,700 levels. Besides, there was a break below a key contracting triangle with support at $2,695 on the hourly chart of ETH/USD.
Ethereum price is now trading below $2,700 and the 100-hourly Simple Moving Average. A low is formed near $2,635 and the price is now consolidating. If there is another increase, the price might face hurdles near the $2,700 level. It is close to the 50% Fib retracement level of the recent decline from the $2,763 swing high to the $2,635 low.
The first major resistance is near the $2,735 level or the 76.4% Fib retracement level of the recent decline from the $2,763 swing high to the $2,635 low. A close above the $2,735 level might send Ether toward the $2,765 resistance.
The next key resistance is near $2,800. An upside break above the $2,800 resistance might send the price higher toward the $2,880 resistance zone in the near term.
More Losses In ETH?
If Ethereum fails to clear the $2,700 resistance, it could continue to move down. Initial support on the downside is near $2,635. The first major support sits near the $2,600 zone.
A clear move below the $2,600 support might push the price toward $2,550. Any more losses might send the price toward the $2,520 support level in the near term. The next key support sits at $2,440.
Technical Indicators
Hourly MACD – The MACD for ETH/USD is losing momentum in the bullish zone.
Hourly RSI – The RSI for ETH/USD is now below the 50 zone.
Major Support Level – $2,635
Major Resistance Level – $2,700
What's Your Reaction?