Ethereum Price Rises, Striving to Catch Up with Bitcoin’s Rally
Ethereum price gained pace for a move above the $2,550 resistance zone. ETH is now consolidating near $2,680 and eyeing more upsides above $2,750. Ethereum started a decent increase above the $2,450 and $2,550 levels. The price is trading above $2,550 and the 100-hourly Simple Moving Average. There is a key bullish trend line forming with support at $2,550 on the hourly chart of ETH/USD (data feed via Kraken). The pair could rise steadily if it clears the $2,720 resistance zone. Ethereum Price Eyes More Gains Above $2,720 Ethereum price started a steady upward move above the $2,450 resistance level. ETH climbed above the $2,500 and $2,550 resistance levels like Bitcoin above $58,000. The price even cleared the $2,650 resistance but gains were limited compared to BTC. A high was formed near $2,722 and the price is now consolidating gains. It is still above the 23.6% Fib retracement level of the upward move from the $2,311 swing low to the $2,722 high. Ethereum price is now trading above $2,550 and the 100-hourly Simple Moving Average. There is also a key bullish trend line forming with support at $2,550 on the hourly chart of ETH/USD. The trend line is close to the 100-hourly Simple Moving Average and the 50% Fib retracement level of the upward move from the $2,311 swing low to the $2,722 high. On the upside, the price is facing hurdles near the $2,700 level. The first major resistance is near the $2,720 level. A close above the $2,720 level might send Ether toward the $2,800 resistance. The next key resistance is near $2,865. An upside break above the $2,865 resistance might send the price higher toward the $3,000 resistance zone in the near term. Are Dips Limited In ETH? If Ethereum fails to clear the $2,720 resistance, it could start a downside correction. Initial support on the downside is near $2,620. The first major support sits near the $2,550 zone. A clear move below the $2,550 support might push the price toward $2,450. Any more losses might send the price toward the $2,320 support level in the near term. The next key support sits at $2,250. Technical Indicators Hourly MACD – The MACD for ETH/USD is gaining momentum in the bullish zone. Hourly RSI – The RSI for ETH/USD is now above the 50 zone. Major Support Level – $2,550 Major Resistance Level – $2,720

Ethereum price gained pace for a move above the $2,550 resistance zone. ETH is now consolidating near $2,680 and eyeing more upsides above $2,750.
- Ethereum started a decent increase above the $2,450 and $2,550 levels.
- The price is trading above $2,550 and the 100-hourly Simple Moving Average.
- There is a key bullish trend line forming with support at $2,550 on the hourly chart of ETH/USD (data feed via Kraken).
- The pair could rise steadily if it clears the $2,720 resistance zone.
Ethereum Price Eyes More Gains Above $2,720
Ethereum price started a steady upward move above the $2,450 resistance level. ETH climbed above the $2,500 and $2,550 resistance levels like Bitcoin above $58,000.
The price even cleared the $2,650 resistance but gains were limited compared to BTC. A high was formed near $2,722 and the price is now consolidating gains. It is still above the 23.6% Fib retracement level of the upward move from the $2,311 swing low to the $2,722 high.
Ethereum price is now trading above $2,550 and the 100-hourly Simple Moving Average. There is also a key bullish trend line forming with support at $2,550 on the hourly chart of ETH/USD. The trend line is close to the 100-hourly Simple Moving Average and the 50% Fib retracement level of the upward move from the $2,311 swing low to the $2,722 high.
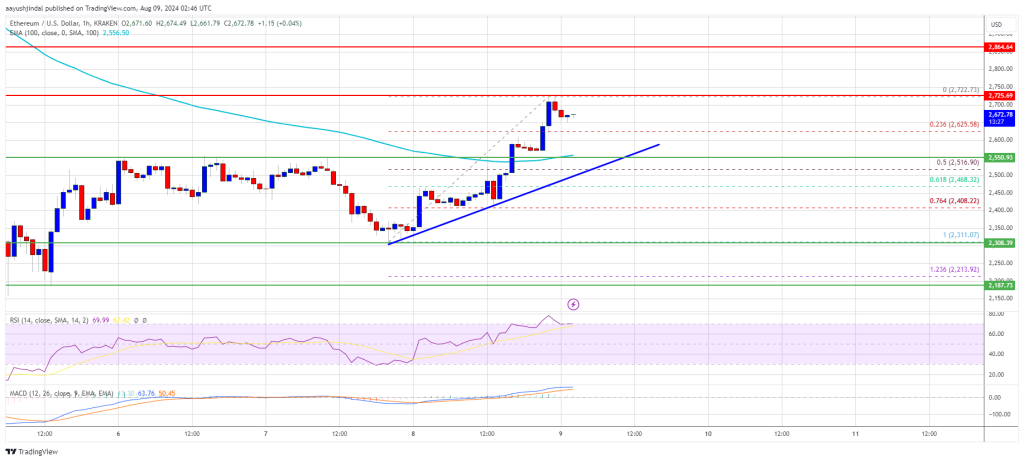
On the upside, the price is facing hurdles near the $2,700 level. The first major resistance is near the $2,720 level. A close above the $2,720 level might send Ether toward the $2,800 resistance. The next key resistance is near $2,865. An upside break above the $2,865 resistance might send the price higher toward the $3,000 resistance zone in the near term.
Are Dips Limited In ETH?
If Ethereum fails to clear the $2,720 resistance, it could start a downside correction. Initial support on the downside is near $2,620. The first major support sits near the $2,550 zone.
A clear move below the $2,550 support might push the price toward $2,450. Any more losses might send the price toward the $2,320 support level in the near term. The next key support sits at $2,250.
Technical Indicators
Hourly MACD – The MACD for ETH/USD is gaining momentum in the bullish zone.
Hourly RSI – The RSI for ETH/USD is now above the 50 zone.
Major Support Level – $2,550
Major Resistance Level – $2,720
What's Your Reaction?