Ethereum Price Bottom Signal: Is a Recovery on the Horizon?
Ethereum price extended losses below the $3,320 support. ETH tested the $3,240 support and is now eyeing a decent increase above the $3,380 resistance. Ethereum extended losses and tested the $3,240 support zone. The price is trading below $3,400 and the 100-hourly Simple Moving Average. There is a key bearish trend line forming with resistance near $3,440 on the hourly chart of ETH/USD (data feed via Kraken). The pair could attempt a decent increase above the $3,380 and $3,400 resistance levels. Ethereum Price Founds Support Ethereum price struggled to start a fresh increase above the $3,500 zone. ETH followed Bitcoin’s bearish path and the price declined below the $3,350 level. The bears pushed the price below the $3,320 support zone. A low was formed at $3,230 and the price is now correcting losses. There was a minor upward move above the $3,300 and $3,320 levels. The price climbed above the 23.6% Fib retracement level of the recent drop from the $3,517 swing high to the $3,230 low. Ethereum is still trading below $3,450 and the 100-hourly Simple Moving Average. On the upside, the price might face resistance near the $3,375 level or the 50% Fib retracement level of the recent drop from the $3,517 swing high to the $3,230 low. The first major resistance is near the $3,450 level. There is also a key bearish trend line forming with resistance near $3,440 on the hourly chart of ETH/USD. The main resistance sits at $3,540. An upside break above the $3,540 resistance might send the price higher. The next key resistance sits at $3,620, above which the price might gain traction and rise toward the $3,650 level. Any more gains could send Ether toward the $3,720 resistance zone in the coming days. Another Decline In ETH? If Ethereum fails to clear the $3,450 resistance, it could start another decline. Initial support on the downside is near $3,325. The first major support sits near the $3,24 zone. A clear move below the $3,240 support might push the price toward $3,200. Any more losses might send the price toward the $3,120 level in the near term. Technical Indicators Hourly MACD – The MACD for ETH/USD is losing momentum in the bearish zone. Hourly RSI – The RSI for ETH/USD is now above the 50 zone. Major Support Level – $3,240 Major Resistance Level – $3,450

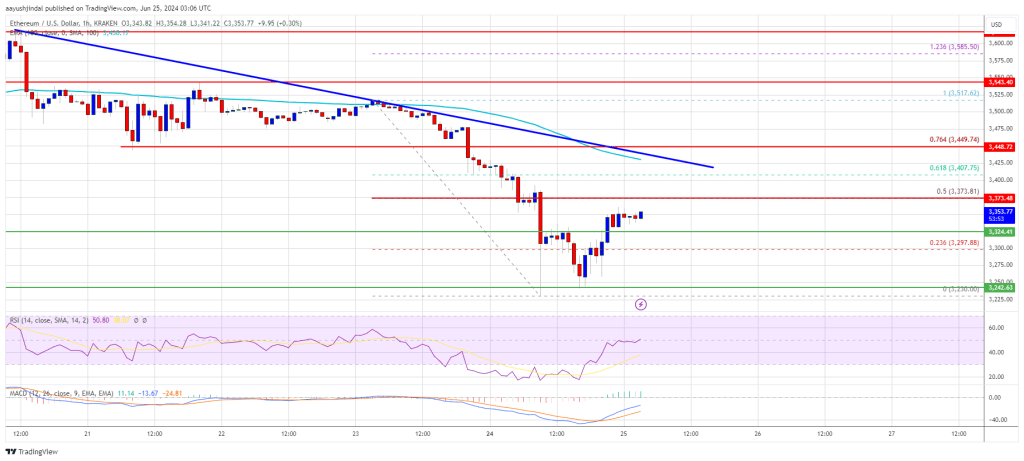
Ethereum price extended losses below the $3,320 support. ETH tested the $3,240 support and is now eyeing a decent increase above the $3,380 resistance.
- Ethereum extended losses and tested the $3,240 support zone.
- The price is trading below $3,400 and the 100-hourly Simple Moving Average.
- There is a key bearish trend line forming with resistance near $3,440 on the hourly chart of ETH/USD (data feed via Kraken).
- The pair could attempt a decent increase above the $3,380 and $3,400 resistance levels.
Ethereum Price Founds Support
Ethereum price struggled to start a fresh increase above the $3,500 zone. ETH followed Bitcoin’s bearish path and the price declined below the $3,350 level. The bears pushed the price below the $3,320 support zone.
A low was formed at $3,230 and the price is now correcting losses. There was a minor upward move above the $3,300 and $3,320 levels. The price climbed above the 23.6% Fib retracement level of the recent drop from the $3,517 swing high to the $3,230 low.
Ethereum is still trading below $3,450 and the 100-hourly Simple Moving Average. On the upside, the price might face resistance near the $3,375 level or the 50% Fib retracement level of the recent drop from the $3,517 swing high to the $3,230 low.
The first major resistance is near the $3,450 level. There is also a key bearish trend line forming with resistance near $3,440 on the hourly chart of ETH/USD.
The main resistance sits at $3,540. An upside break above the $3,540 resistance might send the price higher. The next key resistance sits at $3,620, above which the price might gain traction and rise toward the $3,650 level. Any more gains could send Ether toward the $3,720 resistance zone in the coming days.
Another Decline In ETH?
If Ethereum fails to clear the $3,450 resistance, it could start another decline. Initial support on the downside is near $3,325. The first major support sits near the $3,24 zone.
A clear move below the $3,240 support might push the price toward $3,200. Any more losses might send the price toward the $3,120 level in the near term.
Technical Indicators
Hourly MACD – The MACD for ETH/USD is losing momentum in the bearish zone.
Hourly RSI – The RSI for ETH/USD is now above the 50 zone.
Major Support Level – $3,240
Major Resistance Level – $3,450
What's Your Reaction?