BNB Price Struggles as Bullish Momentum Wanes: Can It Overcome Hurdles?
BNB price started a recovery wave from the $550 support. The price is now consolidating and facing hurdles near the $585 and $592 levels. BNB price started a decent upward move from the $550 support zone. The price is now trading above $575 and the 100-hourly simple moving average. There is a short-term rising channel forming with support at $578 on the hourly chart of the BNB/USD pair (data source from Binance). The pair could gain bullish momentum if there is a close above the $585 resistance. BNB Price Aims Higher In the past few days, BNB price saw a steady decline from the $592 resistance, like Ethereum and Bitcoin. There was a drop below the $575 support and $560. Finally, the bulls appeared near $550. A low was formed at $550.8 and the price recently started a recovery wave. There was a move above the $565 and $575 resistance levels. The price surpassed the 61.8% Fib retracement level of the downward move from the $593 swing high to the $550 low. There is also a short-term rising channel forming with support at $578 on the hourly chart of the BNB/USD pair. The price is now trading above $575 and the 100-hourly simple moving average. Immediate resistance is near the $583 level or the 76.4% Fib retracement level of the downward move from the $593 swing high to the $550 low. The next resistance sits near the $585 level. A clear move above the $585 zone could send the price higher. In the stated case, BNB price could test $592. A close above the $592 resistance might set the pace for a larger increase toward the $620 resistance. Any more gains might call for a test of the $632 level in the coming days. Another Decline? If BNB fails to clear the $585 resistance, it could start another decline. Initial support on the downside is near the $578 level and the channel’s trend line. The next major support is near the $572 level. The main support sits at $565. If there is a downside break below the $565 support, the price could drop toward the $550 support. Any more losses could initiate a larger decline toward the $532 level. Technical Indicators Hourly MACD – The MACD for BNB/USD is losing pace in the bullish zone. Hourly RSI (Relative Strength Index) – The RSI for BNB/USD is currently above the 50 level. Major Support Levels – $572 and $565. Major Resistance Levels – $585 and $592.

BNB price started a recovery wave from the $550 support. The price is now consolidating and facing hurdles near the $585 and $592 levels.
- BNB price started a decent upward move from the $550 support zone.
- The price is now trading above $575 and the 100-hourly simple moving average.
- There is a short-term rising channel forming with support at $578 on the hourly chart of the BNB/USD pair (data source from Binance).
- The pair could gain bullish momentum if there is a close above the $585 resistance.
BNB Price Aims Higher
In the past few days, BNB price saw a steady decline from the $592 resistance, like Ethereum and Bitcoin. There was a drop below the $575 support and $560. Finally, the bulls appeared near $550.
A low was formed at $550.8 and the price recently started a recovery wave. There was a move above the $565 and $575 resistance levels. The price surpassed the 61.8% Fib retracement level of the downward move from the $593 swing high to the $550 low. There is also a short-term rising channel forming with support at $578 on the hourly chart of the BNB/USD pair.
The price is now trading above $575 and the 100-hourly simple moving average. Immediate resistance is near the $583 level or the 76.4% Fib retracement level of the downward move from the $593 swing high to the $550 low. The next resistance sits near the $585 level.
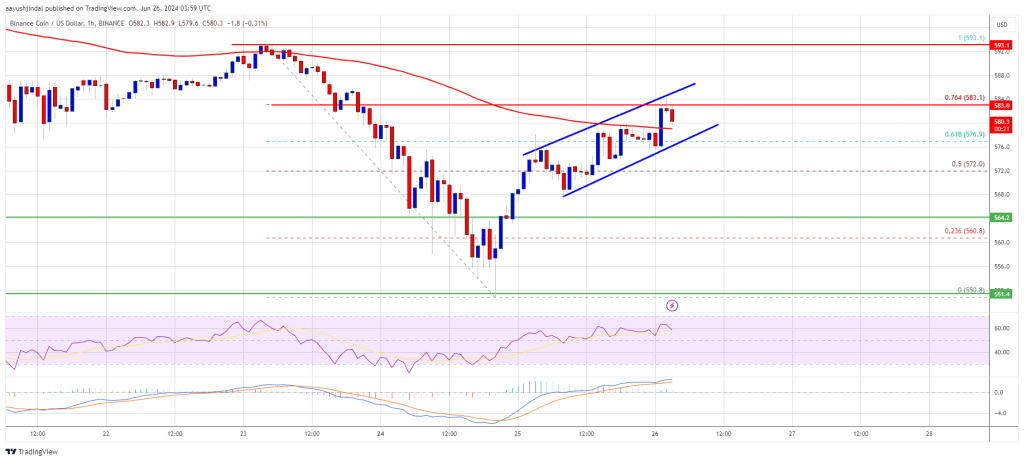
A clear move above the $585 zone could send the price higher. In the stated case, BNB price could test $592. A close above the $592 resistance might set the pace for a larger increase toward the $620 resistance. Any more gains might call for a test of the $632 level in the coming days.
Another Decline?
If BNB fails to clear the $585 resistance, it could start another decline. Initial support on the downside is near the $578 level and the channel’s trend line.
The next major support is near the $572 level. The main support sits at $565. If there is a downside break below the $565 support, the price could drop toward the $550 support. Any more losses could initiate a larger decline toward the $532 level.
Technical Indicators
Hourly MACD – The MACD for BNB/USD is losing pace in the bullish zone.
Hourly RSI (Relative Strength Index) – The RSI for BNB/USD is currently above the 50 level.
Major Support Levels – $572 and $565.
Major Resistance Levels – $585 and $592.
What's Your Reaction?