Bitcoin Price Tests Support: Will It Bounce Back Stronger?
Bitcoin price failed to clear the $61,500 resistance zone. BTC is now retesting the $58,000 support and might attempt a fresh increase. Bitcoin started a fresh decline from the $61,500 resistance zone. The price is trading below $60,000 and the 100 hourly Simple moving average. There was a break below a key bullish trend line with support at $59,250 on the hourly chart of the BTC/USD pair (data feed from Kraken). The pair might attempt a fresh increase if it stays above the $58,000 zone. Bitcoin Price Holds Support Bitcoin price failed to settle above the $61,500 resistance zone. BTC formed a short-term top and started a fresh decline below the $60,500 level. There was a move below the $60,000 and $59,000 levels. Besides, there was a break below a key bullish trend line with support at $59,250 on the hourly chart of the BTC/USD pair. The pair retested the $58,000 support zone. A low is formed at $58,061 and the price is now consolidating losses. Bitcoin price is now trading below $60,000 and the 100 hourly Simple moving average. On the upside, the price could face resistance near the $58,800 level. It is close to the 23.6% Fib retracement level of the downward move from the $61,438 swing high to the $58,061 low. The first key resistance is near the $59,500 level or the 50% Fib retracement level of the downward move from the $61,438 swing high to the $58,061 low A clear move above the $59,500 resistance might send the price further higher in the coming sessions. The next key resistance could be $60,000. The next major hurdle sits at $61,500. A close above the $61,500 resistance might spark more upsides. In the stated case, the price could rise and test the $63,500 resistance. More Losses In BTC? If Bitcoin fails to rise above the $58,800 resistance zone, it could continue to move down. Immediate support on the downside is near the $58,000 level. The first major support is $57,650. The next support is now near the $56,500 zone. Any more losses might send the price toward the $55,500 support zone or even $55,000 in the near term. Technical indicators: Hourly MACD – The MACD is now gaining pace in the bearish zone. Hourly RSI (Relative Strength Index) – The RSI for BTC/USD is now below the 50 level. Major Support Levels – $58,000, followed by $57,650. Major Resistance Levels – $58,800, and $59,500.

Bitcoin price failed to clear the $61,500 resistance zone. BTC is now retesting the $58,000 support and might attempt a fresh increase.
- Bitcoin started a fresh decline from the $61,500 resistance zone.
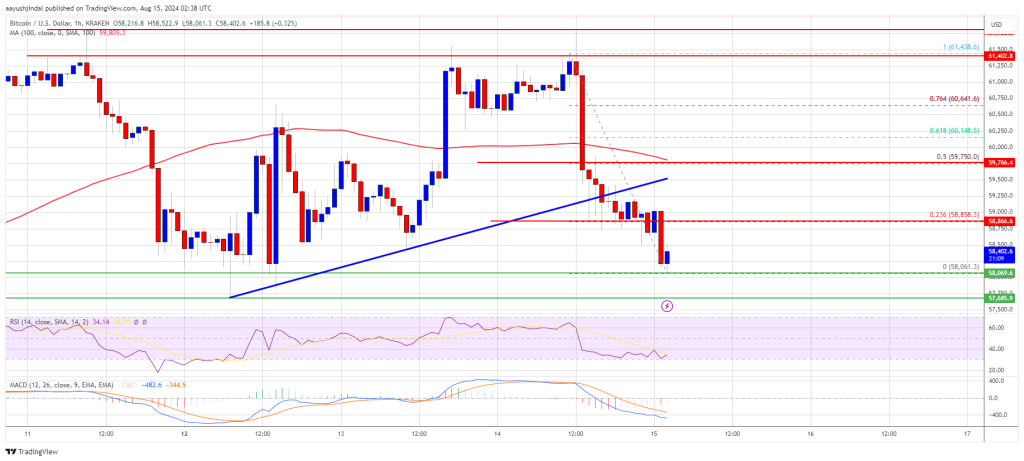
- The price is trading below $60,000 and the 100 hourly Simple moving average.
- There was a break below a key bullish trend line with support at $59,250 on the hourly chart of the BTC/USD pair (data feed from Kraken).
- The pair might attempt a fresh increase if it stays above the $58,000 zone.
Bitcoin Price Holds Support
Bitcoin price failed to settle above the $61,500 resistance zone. BTC formed a short-term top and started a fresh decline below the $60,500 level. There was a move below the $60,000 and $59,000 levels.
Besides, there was a break below a key bullish trend line with support at $59,250 on the hourly chart of the BTC/USD pair. The pair retested the $58,000 support zone. A low is formed at $58,061 and the price is now consolidating losses.
Bitcoin price is now trading below $60,000 and the 100 hourly Simple moving average. On the upside, the price could face resistance near the $58,800 level. It is close to the 23.6% Fib retracement level of the downward move from the $61,438 swing high to the $58,061 low.
The first key resistance is near the $59,500 level or the 50% Fib retracement level of the downward move from the $61,438 swing high to the $58,061 low A clear move above the $59,500 resistance might send the price further higher in the coming sessions. The next key resistance could be $60,000.
The next major hurdle sits at $61,500. A close above the $61,500 resistance might spark more upsides. In the stated case, the price could rise and test the $63,500 resistance.
More Losses In BTC?
If Bitcoin fails to rise above the $58,800 resistance zone, it could continue to move down. Immediate support on the downside is near the $58,000 level.
The first major support is $57,650. The next support is now near the $56,500 zone. Any more losses might send the price toward the $55,500 support zone or even $55,000 in the near term.
Technical indicators:
Hourly MACD – The MACD is now gaining pace in the bearish zone.
Hourly RSI (Relative Strength Index) – The RSI for BTC/USD is now below the 50 level.
Major Support Levels – $58,000, followed by $57,650.
Major Resistance Levels – $58,800, and $59,500.
What's Your Reaction?