Bitcoin Price Targets Recovery: Will It Surpass the $60K Mark?
Bitcoin price is slowly moving higher above the $56,500 level. BTC might gain bullish momentum if it clears the $58,500 resistance zone. Bitcoin started a recovery wave above the $56,500 and $57,000 levels. The price is trading above $57,000 and the 100 hourly Simple moving average. There is a connecting bullish trend line forming with support at $57,200 on the hourly chart of the BTC/USD pair (data feed from Kraken). The pair might start a fresh increase above the $58,500 resistance zone. Bitcoin Price Aims Higher Bitcoin price started a recovery wave above the $56,500 level. BTC even climbed above the $57,500 level. However, the bears are again active near the $58,500 resistance zone. A high was formed at $58,200 and the price is now consolidating in a range. It also tested the 23.6% Fib retracement level of the upward move from the $54,955 swing low to the $58,200 high. The bulls seem to be active above the $57,000 level. Bitcoin price is now trading above $57,200 and the 100 hourly Simple moving average. There is also a connecting bullish trend line forming with support at $57,200 on the hourly chart of the BTC/USD pair. Immediate resistance on the upside is near the $58,200 level. The first key resistance is near the $58,500 level. A clear move above the $58,500 resistance might start a decent increase in the coming sessions. The next key resistance could be $59,200. A close above the $59,200 resistance might start a steady increase and send the price higher. In the stated case, the price could rise and test the $60,000 resistance. Any more gains might be difficult. Another Decline In BTC? If Bitcoin fails to climb above the $58,500 resistance zone, it could start another decline. Immediate support on the downside is near the $57,400 level. The first major support is $57,200 and the trend line. The next support is now near $56,200 and the 61.8% Fib retracement level of the upward move from the $54,955 swing low to the $58,200 high. Any more losses might send the price toward the $55,000 support zone in the near term. Technical indicators: Hourly MACD – The MACD is now losing pace in the bearish zone. Hourly RSI (Relative Strength Index) – The RSI for BTC/USD is now above the 50 level. Major Support Levels – $57,200, followed by $56,200. Major Resistance Levels – $58,200, and $58,500.

Bitcoin price is slowly moving higher above the $56,500 level. BTC might gain bullish momentum if it clears the $58,500 resistance zone.
- Bitcoin started a recovery wave above the $56,500 and $57,000 levels.
- The price is trading above $57,000 and the 100 hourly Simple moving average.
- There is a connecting bullish trend line forming with support at $57,200 on the hourly chart of the BTC/USD pair (data feed from Kraken).
- The pair might start a fresh increase above the $58,500 resistance zone.
Bitcoin Price Aims Higher
Bitcoin price started a recovery wave above the $56,500 level. BTC even climbed above the $57,500 level. However, the bears are again active near the $58,500 resistance zone.
A high was formed at $58,200 and the price is now consolidating in a range. It also tested the 23.6% Fib retracement level of the upward move from the $54,955 swing low to the $58,200 high. The bulls seem to be active above the $57,000 level.
Bitcoin price is now trading above $57,200 and the 100 hourly Simple moving average. There is also a connecting bullish trend line forming with support at $57,200 on the hourly chart of the BTC/USD pair. Immediate resistance on the upside is near the $58,200 level.
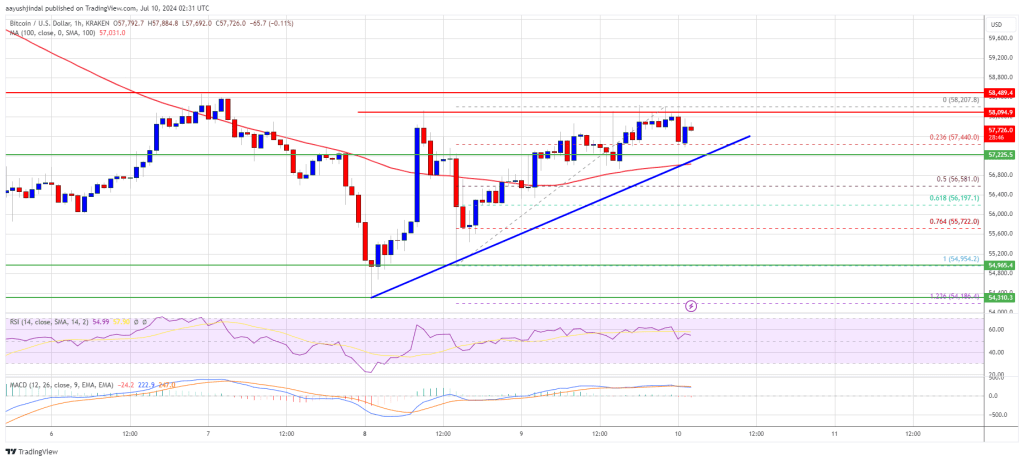
The first key resistance is near the $58,500 level. A clear move above the $58,500 resistance might start a decent increase in the coming sessions. The next key resistance could be $59,200. A close above the $59,200 resistance might start a steady increase and send the price higher. In the stated case, the price could rise and test the $60,000 resistance. Any more gains might be difficult.
Another Decline In BTC?
If Bitcoin fails to climb above the $58,500 resistance zone, it could start another decline. Immediate support on the downside is near the $57,400 level.
The first major support is $57,200 and the trend line. The next support is now near $56,200 and the 61.8% Fib retracement level of the upward move from the $54,955 swing low to the $58,200 high. Any more losses might send the price toward the $55,000 support zone in the near term.
Technical indicators:
Hourly MACD – The MACD is now losing pace in the bearish zone.
Hourly RSI (Relative Strength Index) – The RSI for BTC/USD is now above the 50 level.
Major Support Levels – $57,200, followed by $56,200.
Major Resistance Levels – $58,200, and $58,500.
What's Your Reaction?