Bitcoin Price Remains at Risk Despite Recent Moves, Indicators Turn Bearish
Bitcoin price extended its losses and traded below the $64,500 level. BTC is correcting losses, but the bears are still in control and aim for more losses. Bitcoin remained in a bearish zone and traded below $64,500. The price is trading below $65,500 and the 100 hourly Simple moving average. There is a connecting trend line forming with resistance at $65,400 on the hourly chart of the BTC/USD pair (data feed from Kraken). The pair remains at risk of more downsides below the $64,000 support zone. Bitcoin Price Dips Further Bitcoin price remained in a bearish zone after it settled below the $66,500 resistance zone. BTC extended losses and traded below the $65,000 level. There was also a dip below $64,500. A low was formed at $64,050 and the price is now correcting losses. There was a minor recovery above the $64,500 level. The price climbed above the 23.6% Fib retracement level of the downward wave from the $67,255 swing high to the $64,050 low. Bitcoin is now trading below $65,500 and the 100 hourly Simple moving average. There is also a connecting trend line forming with resistance at $65,400 on the hourly chart of the BTC/USD pair. On the upside, the price is facing resistance near the $65,500 level and the trend line. The first major resistance could be $65,650 or the 50% Fib retracement level of the downward wave from the $67,255 swing high to the $64,050 low. The next key resistance could be $66,000. A clear move above the $66,000 resistance might start a decent increase and send the price higher. In the stated case, the price could rise and test the $66,500 resistance. Any more gains might send BTC toward the $67,500 resistance in the near term. More Losses In BTC? If Bitcoin fails to climb above the $65,400 resistance zone, it could start another decline. Immediate support on the downside is near the $64,800 level. The first major support is $64,200. The next support is now forming near $64,000. Any more losses might send the price toward the $63,200 support zone in the near term. Technical indicators: Hourly MACD – The MACD is now losing pace in the bearish zone. Hourly RSI (Relative Strength Index) – The RSI for BTC/USD is now near the 50 level. Major Support Levels – $64,500, followed by $64,000. Major Resistance Levels – $65,400, and $66,000.

Bitcoin price extended its losses and traded below the $64,500 level. BTC is correcting losses, but the bears are still in control and aim for more losses.
- Bitcoin remained in a bearish zone and traded below $64,500.
- The price is trading below $65,500 and the 100 hourly Simple moving average.
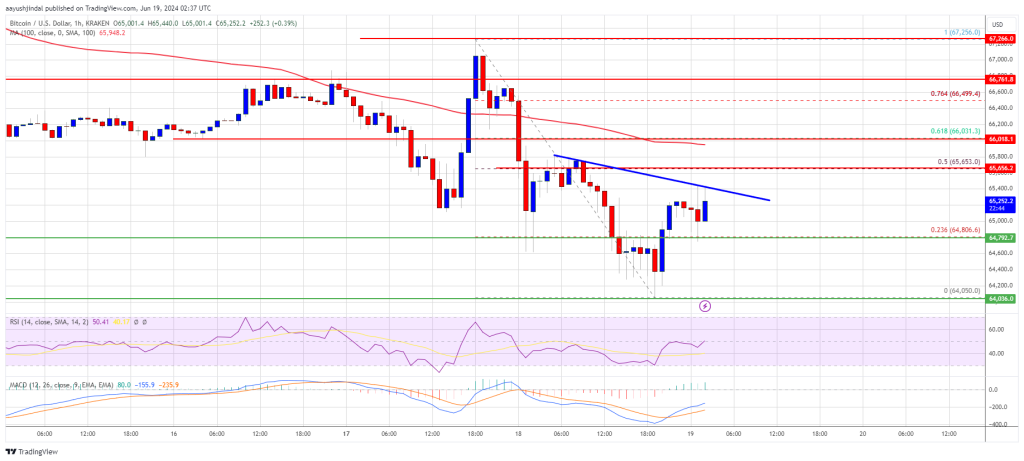
- There is a connecting trend line forming with resistance at $65,400 on the hourly chart of the BTC/USD pair (data feed from Kraken).
- The pair remains at risk of more downsides below the $64,000 support zone.
Bitcoin Price Dips Further
Bitcoin price remained in a bearish zone after it settled below the $66,500 resistance zone. BTC extended losses and traded below the $65,000 level. There was also a dip below $64,500.
A low was formed at $64,050 and the price is now correcting losses. There was a minor recovery above the $64,500 level. The price climbed above the 23.6% Fib retracement level of the downward wave from the $67,255 swing high to the $64,050 low.
Bitcoin is now trading below $65,500 and the 100 hourly Simple moving average. There is also a connecting trend line forming with resistance at $65,400 on the hourly chart of the BTC/USD pair.
On the upside, the price is facing resistance near the $65,500 level and the trend line. The first major resistance could be $65,650 or the 50% Fib retracement level of the downward wave from the $67,255 swing high to the $64,050 low. The next key resistance could be $66,000.
A clear move above the $66,000 resistance might start a decent increase and send the price higher. In the stated case, the price could rise and test the $66,500 resistance. Any more gains might send BTC toward the $67,500 resistance in the near term.
More Losses In BTC?
If Bitcoin fails to climb above the $65,400 resistance zone, it could start another decline. Immediate support on the downside is near the $64,800 level.
The first major support is $64,200. The next support is now forming near $64,000. Any more losses might send the price toward the $63,200 support zone in the near term.
Technical indicators:
Hourly MACD – The MACD is now losing pace in the bearish zone.
Hourly RSI (Relative Strength Index) – The RSI for BTC/USD is now near the 50 level.
Major Support Levels – $64,500, followed by $64,000.
Major Resistance Levels – $65,400, and $66,000.
What's Your Reaction?