Bitcoin Price Holds in Range: Can Bulls Launch a Recovery?
Bitcoin price started a consolidation phase near the $58,500 level. BTC must clear the $60,500 resistance to start a recovery wave in the near term. Bitcoin tested the $58,000 zone before there was a minor recovery. The price is trading below $62,000 and the 100 hourly Simple moving average. There is a major bearish trend line forming with resistance at $60,200 on the hourly chart of the BTC/USD pair (data feed from Kraken). The pair might slip again if there is no move above the $60,500 resistance. Bitcoin Price Starts Consolidation Bitcoin price gained bearish momentum below the $62,500 level. The price even dived below the $60,000 level. Finally, the bulls appeared near the $58,000 level. A low was formed at $58,009 and the price is now consolidating losses. There was a minor recovery wave above the $58,500 and $58,800 levels. The price tested the 23.6% Fib retracement level of the downward wave from the $65,070 swing high to the $58,009 low. Bitcoin is now trading below $61,200 and the 100 hourly Simple moving average. On the upside, the price could face resistance near the $59,650 level. The first key resistance is near the $60,000 level. There is also a major bearish trend line forming with resistance at $60,200 on the hourly chart of the BTC/USD pair. A clear move above the $60,200 resistance might send the price further higher in the coming sessions. The next key resistance could be $61,500. It is close to the 50% Fib retracement level of the downward wave from the $65,070 swing high to the $58,009 low. A close above the $61,500 resistance might spark more upsides. In the stated case, the price could rise and test the $62,500 resistance. More Downsides In BTC? If Bitcoin fails to rise above the $60,200 resistance zone, it could continue to move down. Immediate support on the downside is near the $58,550 level. The first major support is $58,000. The next support is now near the $57,650 zone. Any more losses might send the price toward the $56,500 support in the near term. Technical indicators: Hourly MACD – The MACD is now losing pace in the bearish zone. Hourly RSI (Relative Strength Index) – The RSI for BTC/USD is now below the 50 level. Major Support Levels – $58,550, followed by $58,000. Major Resistance Levels – $60,200, and $61,500.

Bitcoin price started a consolidation phase near the $58,500 level. BTC must clear the $60,500 resistance to start a recovery wave in the near term.
- Bitcoin tested the $58,000 zone before there was a minor recovery.
- The price is trading below $62,000 and the 100 hourly Simple moving average.
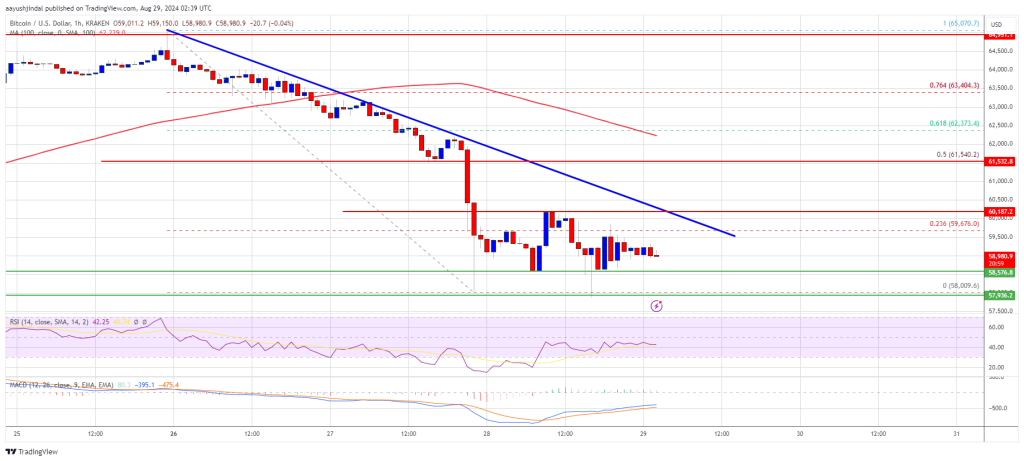
- There is a major bearish trend line forming with resistance at $60,200 on the hourly chart of the BTC/USD pair (data feed from Kraken).
- The pair might slip again if there is no move above the $60,500 resistance.
Bitcoin Price Starts Consolidation
Bitcoin price gained bearish momentum below the $62,500 level. The price even dived below the $60,000 level. Finally, the bulls appeared near the $58,000 level.
A low was formed at $58,009 and the price is now consolidating losses. There was a minor recovery wave above the $58,500 and $58,800 levels. The price tested the 23.6% Fib retracement level of the downward wave from the $65,070 swing high to the $58,009 low.
Bitcoin is now trading below $61,200 and the 100 hourly Simple moving average. On the upside, the price could face resistance near the $59,650 level. The first key resistance is near the $60,000 level. There is also a major bearish trend line forming with resistance at $60,200 on the hourly chart of the BTC/USD pair.
A clear move above the $60,200 resistance might send the price further higher in the coming sessions. The next key resistance could be $61,500. It is close to the 50% Fib retracement level of the downward wave from the $65,070 swing high to the $58,009 low.
A close above the $61,500 resistance might spark more upsides. In the stated case, the price could rise and test the $62,500 resistance.
More Downsides In BTC?
If Bitcoin fails to rise above the $60,200 resistance zone, it could continue to move down. Immediate support on the downside is near the $58,550 level.
The first major support is $58,000. The next support is now near the $57,650 zone. Any more losses might send the price toward the $56,500 support in the near term.
Technical indicators:
Hourly MACD – The MACD is now losing pace in the bearish zone.
Hourly RSI (Relative Strength Index) – The RSI for BTC/USD is now below the 50 level.
Major Support Levels – $58,550, followed by $58,000.
Major Resistance Levels – $60,200, and $61,500.
What's Your Reaction?