Bitcoin Price Decline Continues: Lower Targets in Sight
Bitcoin price started another decline from the $66,850 resistance zone. BTC is again moving lower and might even decline below the $65,500 support zone. Bitcoin failed to climb above $67,000 and started another decline. The price is trading below $66,800 and the 100 hourly Simple moving average. There was a break below a connecting bullish trend line with support at $66,500 on the hourly chart of the BTC/USD pair (data feed from Kraken). The pair could continue to move down and even trade below the $65,500 support zone. Bitcoin Price Resumes Decline Bitcoin price struggled to climb above the $67,000 resistance zone. BTC remained in a bearish zone and started a fresh decline from the $66,868 high. There was a move below the $66,500 level. Besides, there was a break below a connecting bullish trend line with support at $66,500 on the hourly chart of the BTC/USD pair. The pair traded below the 23.6% Fib retracement level of the upward move from the $65,075 swing low to the $66,868 high. Bitcoin is now trading below $66,800 and the 100 hourly Simple moving average. It seems like the price might soon test the 50% Fib retracement level of the upward move from the $65,075 swing low to the $66,868 high. On the upside, the price is facing resistance near the $66,500 level and the 100 hourly Simple moving average. The first major resistance could be $66,850. The next key resistance could be $67,000. A clear move above the $67,000 resistance might start a decent increase and send the price higher. In the stated case, the price could rise and test the $66,000 resistance. Any more gains might send BTC toward the $68,500 resistance in the near term. More Losses In BTC? If Bitcoin fails to climb above the $66,500 resistance zone, it could continue to move down. Immediate support on the downside is near the $66,000 level. The first major support is $65,750. The next support is now forming near $65,500. Any more losses might send the price toward the $65,000 support zone in the near term. Technical indicators: Hourly MACD – The MACD is now gaining pace in the bearish zone. Hourly RSI (Relative Strength Index) – The RSI for BTC/USD is now below the 50 level. Major Support Levels – $66,500, followed by $65,000. Major Resistance Levels – $66,500, and $67,000.

Bitcoin price started another decline from the $66,850 resistance zone. BTC is again moving lower and might even decline below the $65,500 support zone.
- Bitcoin failed to climb above $67,000 and started another decline.
- The price is trading below $66,800 and the 100 hourly Simple moving average.
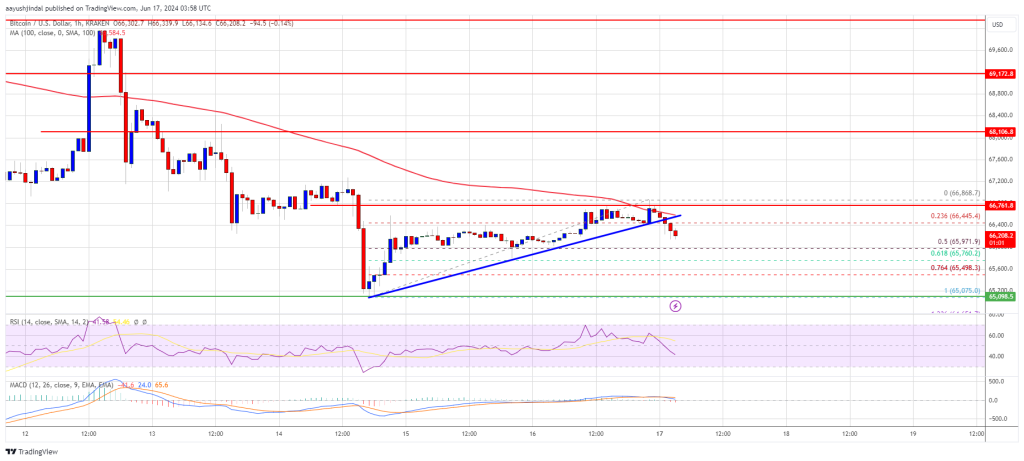
- There was a break below a connecting bullish trend line with support at $66,500 on the hourly chart of the BTC/USD pair (data feed from Kraken).
- The pair could continue to move down and even trade below the $65,500 support zone.
Bitcoin Price Resumes Decline
Bitcoin price struggled to climb above the $67,000 resistance zone. BTC remained in a bearish zone and started a fresh decline from the $66,868 high. There was a move below the $66,500 level.
Besides, there was a break below a connecting bullish trend line with support at $66,500 on the hourly chart of the BTC/USD pair. The pair traded below the 23.6% Fib retracement level of the upward move from the $65,075 swing low to the $66,868 high.
Bitcoin is now trading below $66,800 and the 100 hourly Simple moving average. It seems like the price might soon test the 50% Fib retracement level of the upward move from the $65,075 swing low to the $66,868 high.
On the upside, the price is facing resistance near the $66,500 level and the 100 hourly Simple moving average. The first major resistance could be $66,850. The next key resistance could be $67,000. A clear move above the $67,000 resistance might start a decent increase and send the price higher.
In the stated case, the price could rise and test the $66,000 resistance. Any more gains might send BTC toward the $68,500 resistance in the near term.
More Losses In BTC?
If Bitcoin fails to climb above the $66,500 resistance zone, it could continue to move down. Immediate support on the downside is near the $66,000 level.
The first major support is $65,750. The next support is now forming near $65,500. Any more losses might send the price toward the $65,000 support zone in the near term.
Technical indicators:
Hourly MACD – The MACD is now gaining pace in the bearish zone.
Hourly RSI (Relative Strength Index) – The RSI for BTC/USD is now below the 50 level.
Major Support Levels – $66,500, followed by $65,000.
Major Resistance Levels – $66,500, and $67,000.
What's Your Reaction?