Bitcoin Price Breaks $62K: Rising Bullish Momentum, Will Prices Go Higher?
Bitcoin price started a strong increase and broke the $62,000 resistance level. BTC is showing positive signs and might rise toward the $63,200 level. Bitcoin gained bullish momentum above the $60,500 resistance zone. The price is trading above $61,500 and the 100 hourly Simple moving average. There is a key bullish trend line forming with support at $61,000 on the hourly chart of the BTC/USD pair (data feed from Kraken). The pair might continue to move up if it breaks the $62,500 support. Bitcoin Price Regains Strength Bitcoin price started a decent increase above the $59,500 and $60,000 resistance levels. BTC even cleared the $60,500 resistance to move into a positive zone. It sparked a strong increase and the price climbed above the $62,000 level. It even tested the $62,500 level. A high was formed at $62,493 and the price is now consolidating gains. It is trading well above the 23.6% Fib retracement level of the upward move from the $56,593 swing low to the $62,493 high. Bitcoin price is now trading above $61,500 and the 100 hourly Simple moving average. There is also a key bullish trend line forming with support at $61,000 on the hourly chart of the BTC/USD pair. Immediate resistance on the upside is near the $62,500 level. The first key resistance is near the $62,800 level. A clear move above the $62,800 resistance might start a decent increase in the coming sessions. The next key resistance could be $63,200. The next major hurdle sits at $63,500. A close above the $63,500 resistance might start a steady increase and send the price higher. In the stated case, the price could rise and test the $65,000 resistance. Are Dips Supported In BTC? If Bitcoin fails to climb above the $62,500 resistance zone, it could start a downside correction. Immediate support on the downside is near the $61,500 level. The first major support is $61,000 and the trend line zone. The next support is now near $60,000. Any more losses might send the price toward the $59,500 support zone in the near term. Technical indicators: Hourly MACD – The MACD is now gaining pace in the bullish zone. Hourly RSI (Relative Strength Index) – The RSI for BTC/USD is now above the 50 level. Major Support Levels – $61,500, followed by $61,000. Major Resistance Levels – $62,500, and $63,500.

Bitcoin price started a strong increase and broke the $62,000 resistance level. BTC is showing positive signs and might rise toward the $63,200 level.
- Bitcoin gained bullish momentum above the $60,500 resistance zone.
- The price is trading above $61,500 and the 100 hourly Simple moving average.
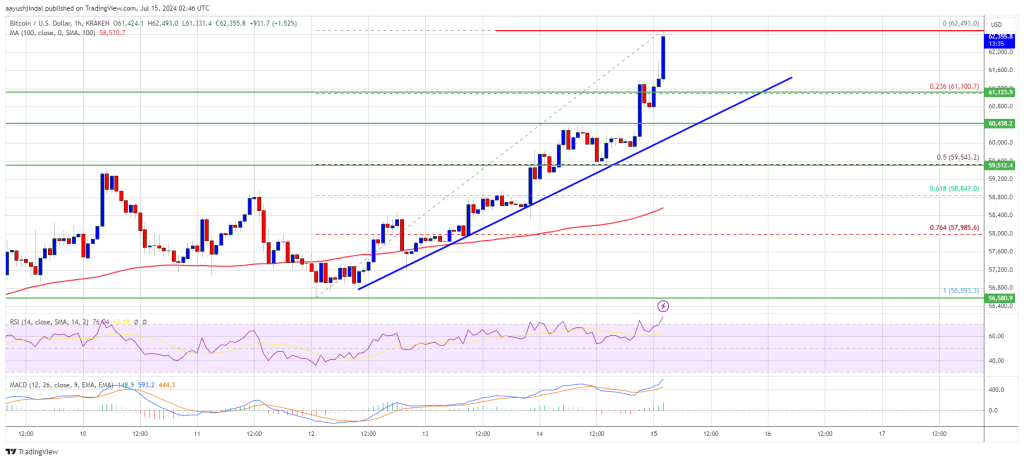
- There is a key bullish trend line forming with support at $61,000 on the hourly chart of the BTC/USD pair (data feed from Kraken).
- The pair might continue to move up if it breaks the $62,500 support.
Bitcoin Price Regains Strength
Bitcoin price started a decent increase above the $59,500 and $60,000 resistance levels. BTC even cleared the $60,500 resistance to move into a positive zone. It sparked a strong increase and the price climbed above the $62,000 level.
It even tested the $62,500 level. A high was formed at $62,493 and the price is now consolidating gains. It is trading well above the 23.6% Fib retracement level of the upward move from the $56,593 swing low to the $62,493 high.
Bitcoin price is now trading above $61,500 and the 100 hourly Simple moving average. There is also a key bullish trend line forming with support at $61,000 on the hourly chart of the BTC/USD pair.
Immediate resistance on the upside is near the $62,500 level. The first key resistance is near the $62,800 level. A clear move above the $62,800 resistance might start a decent increase in the coming sessions. The next key resistance could be $63,200.
The next major hurdle sits at $63,500. A close above the $63,500 resistance might start a steady increase and send the price higher. In the stated case, the price could rise and test the $65,000 resistance.
Are Dips Supported In BTC?
If Bitcoin fails to climb above the $62,500 resistance zone, it could start a downside correction. Immediate support on the downside is near the $61,500 level.
The first major support is $61,000 and the trend line zone. The next support is now near $60,000. Any more losses might send the price toward the $59,500 support zone in the near term.
Technical indicators:
Hourly MACD – The MACD is now gaining pace in the bullish zone.
Hourly RSI (Relative Strength Index) – The RSI for BTC/USD is now above the 50 level.
Major Support Levels – $61,500, followed by $61,000.
Major Resistance Levels – $62,500, and $63,500.
What's Your Reaction?