


Bitcoin Price at Risk of Further Downside: Will Bears Tighten Grip?
Bitcoin price started another decline from the $60,650 resistance. BTC is now at risk of more downsides below the $57,500 support zone. Bitcoin is correcting gains and gaining bearish pace below the $59,000 level. The price is trading below $58,500 and the 100 hourly Simple moving average. There is a connecting bearish trend line forming with resistance at $58,000 on the hourly chart of the BTC/USD pair (data feed from Kraken). The pair could climb again if it stays above the $57,500 support zone. Bitcoin Price Turns Red Bitcoin price struggled to clear the $60,000 resistance zone and started a fresh decline. BTC declined below the $60,000 and $59,500 levels to start a downside correction. There was a drop below the 50% Fib retracement level of the upward move from the $55,550 swing low to the $60,638 high. The bears were able to push the price toward the $57,500 support zone. There is now a connecting bearish trend line forming with resistance at $58,000 on the hourly chart of the BTC/USD pair. Bitcoin is now trading below $58,500 and the 100 hourly Simple moving average. It is testing the 61.8% Fib retracement level of the upward move from the $55,550 swing low to the $60,638 high. On the upside, the price could face resistance near the $58,000 level and the trend line. The first key resistance is near the $59,200 level and the 100 hourly Simple moving average. A clear move above the $59,200 resistance might start a steady increase in the coming sessions. The next key resistance could be $60,000. A close above the $60,000 resistance might spark more upsides. In the stated case, the price could rise and test the $60,650 resistance. More Downsides In BTC? If Bitcoin fails to rise above the $58,000 resistance zone, it could continue to move down. Immediate support on the downside is near the $57,500 level. The first major support is $56,750. The next support is now near the $56,250 zone. Any more losses might send the price toward the $55,550 support in the near term. Technical indicators: Hourly MACD – The MACD is now gaining pace in the bearish zone. Hourly RSI (Relative Strength Index) – The RSI for BTC/USD is now below the 50 level. Major Support Levels – $57,500, followed by $56,750. Major Resistance Levels – $58,000, and $59,200.

Bitcoin price started another decline from the $60,650 resistance. BTC is now at risk of more downsides below the $57,500 support zone.
- Bitcoin is correcting gains and gaining bearish pace below the $59,000 level.
- The price is trading below $58,500 and the 100 hourly Simple moving average.
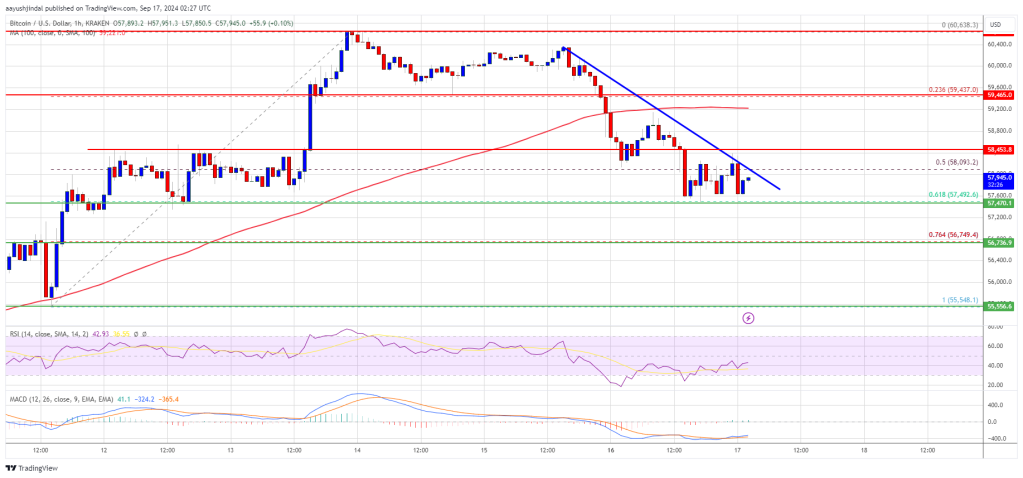
- There is a connecting bearish trend line forming with resistance at $58,000 on the hourly chart of the BTC/USD pair (data feed from Kraken).
- The pair could climb again if it stays above the $57,500 support zone.
Bitcoin Price Turns Red
Bitcoin price struggled to clear the $60,000 resistance zone and started a fresh decline. BTC declined below the $60,000 and $59,500 levels to start a downside correction.
There was a drop below the 50% Fib retracement level of the upward move from the $55,550 swing low to the $60,638 high. The bears were able to push the price toward the $57,500 support zone. There is now a connecting bearish trend line forming with resistance at $58,000 on the hourly chart of the BTC/USD pair.
Bitcoin is now trading below $58,500 and the 100 hourly Simple moving average. It is testing the 61.8% Fib retracement level of the upward move from the $55,550 swing low to the $60,638 high.
On the upside, the price could face resistance near the $58,000 level and the trend line. The first key resistance is near the $59,200 level and the 100 hourly Simple moving average. A clear move above the $59,200 resistance might start a steady increase in the coming sessions.
The next key resistance could be $60,000. A close above the $60,000 resistance might spark more upsides. In the stated case, the price could rise and test the $60,650 resistance.
More Downsides In BTC?
If Bitcoin fails to rise above the $58,000 resistance zone, it could continue to move down. Immediate support on the downside is near the $57,500 level.
The first major support is $56,750. The next support is now near the $56,250 zone. Any more losses might send the price toward the $55,550 support in the near term.
Technical indicators:
Hourly MACD – The MACD is now gaining pace in the bearish zone.
Hourly RSI (Relative Strength Index) – The RSI for BTC/USD is now below the 50 level.
Major Support Levels – $57,500, followed by $56,750.
Major Resistance Levels – $58,000, and $59,200.
What's Your Reaction?


