Avalanche (AVAX) Price Rallies: Can It Break Through the $30 Barrier?
AVAX price is gaining pace above the $28.65 resistance. Avalanche could rise further if there is a clear move above the $30.00 resistance zone. AVAX price is moving higher from the $27.40 support zone against the US dollar. The price is trading above $28.65 and the 100-hourly simple moving average. There was a break above a key declining channel with resistance at $28.40 on the hourly chart of the AVAX/USD pair (data source from Kraken). The pair could continue to rise if it stays above the $28.65 and $28.50 support levels. AVAX Price Aims Higher After a steady decline, Avalanche’s AVAX found support near the $25.00 zone. A support base was formed above $25.00, and the price started a fresh increase, like Bitcoin and Ethereum. The price gained over 8% and broke many hurdles near $28.50. There was a break above a key declining channel with resistance at $28.40 on the hourly chart of the AVAX/USD pair. The pair even cleared the $29.40 resistance to move into a positive zone. AVAX price is now trading above $28.50 and the 100-hourly simple moving average. It is showing positive signs above the 23.6% Fib retracement level of the upward move from the $27.37 swing low to the $29.95 high. On the upside, an immediate resistance is near the $30.00. The next major resistance is forming near the $30.50 zone. If there is an upside break above the $30.50 level, the price could accelerate higher. In the stated case, the price could rise steadily toward the $32.50 level or even $34.00. Dips Supported in Avalanche? If AVAX price fails to continue higher above the $30.00 or $30.50 levels, it could start a downside correction. Immediate support on the downside is near the $29.35 level. The main support is near the $28.65 zone and the 50% Fib retracement level of the upward move from the $27.37 swing low to the $29.95 high. A downside break below the $28.65 level could open the doors for a drop toward $28.00 and the 100 simple moving average (4 hours). The next major support is near the $27.40 level. Technical Indicators Hourly MACD – The MACD for AVAX/USD is gaining momentum in the bullish zone. Hourly RSI (Relative Strength Index) – The RSI for AVAX/USD is now above the 50 level. Major Support Levels – $29.35 and $28.65. Major Resistance Levels – $30.00 and $30.50.

AVAX price is gaining pace above the $28.65 resistance. Avalanche could rise further if there is a clear move above the $30.00 resistance zone.
- AVAX price is moving higher from the $27.40 support zone against the US dollar.
- The price is trading above $28.65 and the 100-hourly simple moving average.
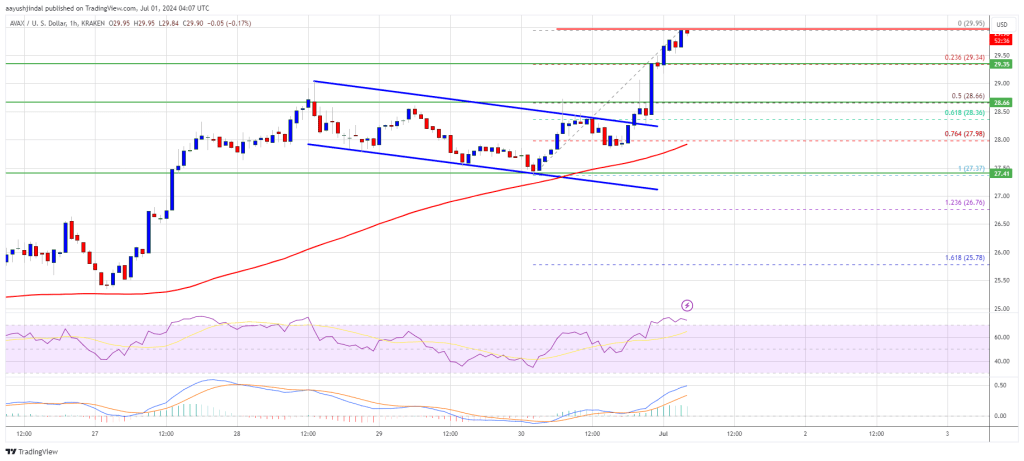
- There was a break above a key declining channel with resistance at $28.40 on the hourly chart of the AVAX/USD pair (data source from Kraken).
- The pair could continue to rise if it stays above the $28.65 and $28.50 support levels.
AVAX Price Aims Higher
After a steady decline, Avalanche’s AVAX found support near the $25.00 zone. A support base was formed above $25.00, and the price started a fresh increase, like Bitcoin and Ethereum.
The price gained over 8% and broke many hurdles near $28.50. There was a break above a key declining channel with resistance at $28.40 on the hourly chart of the AVAX/USD pair. The pair even cleared the $29.40 resistance to move into a positive zone.
AVAX price is now trading above $28.50 and the 100-hourly simple moving average. It is showing positive signs above the 23.6% Fib retracement level of the upward move from the $27.37 swing low to the $29.95 high.
On the upside, an immediate resistance is near the $30.00. The next major resistance is forming near the $30.50 zone. If there is an upside break above the $30.50 level, the price could accelerate higher. In the stated case, the price could rise steadily toward the $32.50 level or even $34.00.
Dips Supported in Avalanche?
If AVAX price fails to continue higher above the $30.00 or $30.50 levels, it could start a downside correction. Immediate support on the downside is near the $29.35 level.
The main support is near the $28.65 zone and the 50% Fib retracement level of the upward move from the $27.37 swing low to the $29.95 high. A downside break below the $28.65 level could open the doors for a drop toward $28.00 and the 100 simple moving average (4 hours). The next major support is near the $27.40 level.
Technical Indicators
Hourly MACD – The MACD for AVAX/USD is gaining momentum in the bullish zone.
Hourly RSI (Relative Strength Index) – The RSI for AVAX/USD is now above the 50 level.
Major Support Levels – $29.35 and $28.65.
Major Resistance Levels – $30.00 and $30.50.
What's Your Reaction?