Altcoin Market Cap Surges Past 200-Day EMA: Is Altseason Finally Here?
Several indicators point to renewed strength in altcoins, suggesting a potential altcoin season on the horizon. However, for confirmation, Bitcoin (BTC) dominance needs to drop further. Altcoin Market Cap Crosses 200-Day EMA Crypto analysts are closely monitoring various indicators that track altcoin behavior, with one critical metric being the 200-day exponential moving average (EMA). Related Reading: Ethereum Gains On Bitcoin Following Fed Rate Cut: Altseason Soon? According to the following chart, the OTHERS index – an index that tracks the market cap of cryptocurrencies excluding the top 10 digital assets by market capitalization – has surged past both the 100-day EMA and the 200-day EMA. For the uninitiated, the 200-day EMA is a commonly used technical indicator that shows the average price of an asset over the past 200 days, with more weightage given to recent prices. It’s used to identify long-term trends – when the price is above the 200-day EMA, it suggests the asset may be in an upward trend, while being below it signals a potential downtrend. At present, the OTHERS index sits at $227.5 billion, while the 200-day EMA and the 100-day EMA are at $221.8 billion and $212.9 billion, respectively. According to crypto analyst Caleb Franzen, the last time this occurred was in July 2023. At the time, altcoins established firm support at these EMAs to achieve higher-highs. Another cryptocurrency analyst, Ali Martinez, alluded to the altcoin market cap – excluding BTC and Ethereum (ETH) – breaking out of what appears to be a long downward trend. Although Martinez is not fully convinced of a full-blown altcoin season yet, he dubs the breakout as a “good start.” Bitcoin Dominance Must Crash Before Altseason While the altcoin market cap breaking out of a sustained downtrend raises hope for an imminent altseason, BTC dominance (BTC.D) must drop significantly from its current levels. Related Reading: Altcoins About To Take Over? Analyst Suggests Time To Accumulate Will End Soon Currently, Bitcoin dominance sits at 57.5%. From the chart below, it is evident that BTC.D has been on a sustained upward trajectory since at least November 2022. According to crypto analyst Yoddha, BTC.D looks poised to crash into the mid-40s, potentially paving the way for a full-blown altseason. Negentropic, co-founder at on-chain data platform Glassnode, remarked that the market seems to be on the verge of an altcoin season. Referring to the Bitcoin-Altcoin Cycle chart from Swissblock, Negentropic notes that once BTC breaks its all-time high (ATH) and enters price discovery mode, altcoin should follow suit. The Bitcoin-Altcoin Cycle chart displays the inverse relationship between BTC and altcoin price movements throughout the year. Any reading above 50 indicates the market has entered an altcoin-dominated phase, whereas a reading below 50 signals a BTC-led market. Despite these promising indicators, it’s important for the leading altcoin, ETH, to rebound against BTC before capital flows into mid-cap and small-cap altcoins. As previously reported, the ETH/BTC trading pair is currently at its lowest since April 2021. At press time, BTC trades at $64,481, up 1.5% in the past 24 hours. Featured image from Unsplash, Charts from Swissblock Technologies and Tradingview.com

Several indicators point to renewed strength in altcoins, suggesting a potential altcoin season on the horizon. However, for confirmation, Bitcoin (BTC) dominance needs to drop further.
Altcoin Market Cap Crosses 200-Day EMA
Crypto analysts are closely monitoring various indicators that track altcoin behavior, with one critical metric being the 200-day exponential moving average (EMA).
According to the following chart, the OTHERS index – an index that tracks the market cap of cryptocurrencies excluding the top 10 digital assets by market capitalization – has surged past both the 100-day EMA and the 200-day EMA.
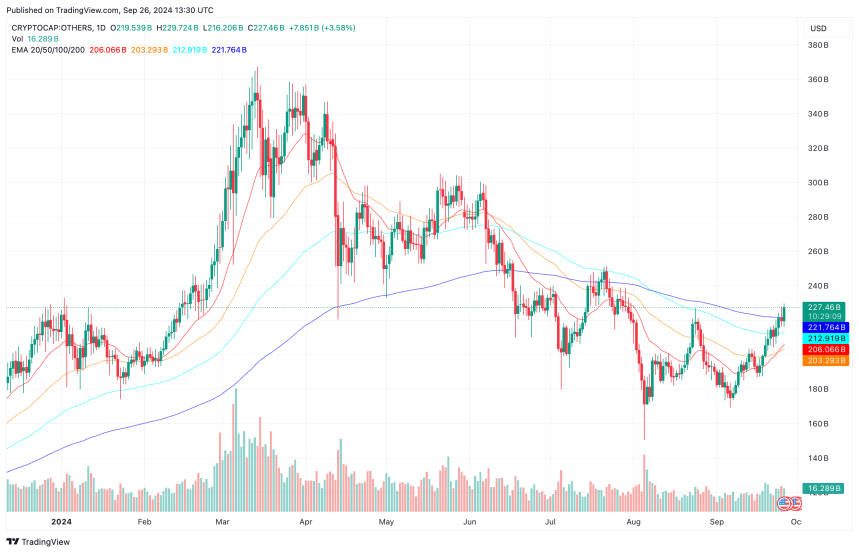
For the uninitiated, the 200-day EMA is a commonly used technical indicator that shows the average price of an asset over the past 200 days, with more weightage given to recent prices. It’s used to identify long-term trends – when the price is above the 200-day EMA, it suggests the asset may be in an upward trend, while being below it signals a potential downtrend.
At present, the OTHERS index sits at $227.5 billion, while the 200-day EMA and the 100-day EMA are at $221.8 billion and $212.9 billion, respectively. According to crypto analyst Caleb Franzen, the last time this occurred was in July 2023. At the time, altcoins established firm support at these EMAs to achieve higher-highs.
Another cryptocurrency analyst, Ali Martinez, alluded to the altcoin market cap – excluding BTC and Ethereum (ETH) – breaking out of what appears to be a long downward trend. Although Martinez is not fully convinced of a full-blown altcoin season yet, he dubs the breakout as a “good start.”
Bitcoin Dominance Must Crash Before Altseason
While the altcoin market cap breaking out of a sustained downtrend raises hope for an imminent altseason, BTC dominance (BTC.D) must drop significantly from its current levels.
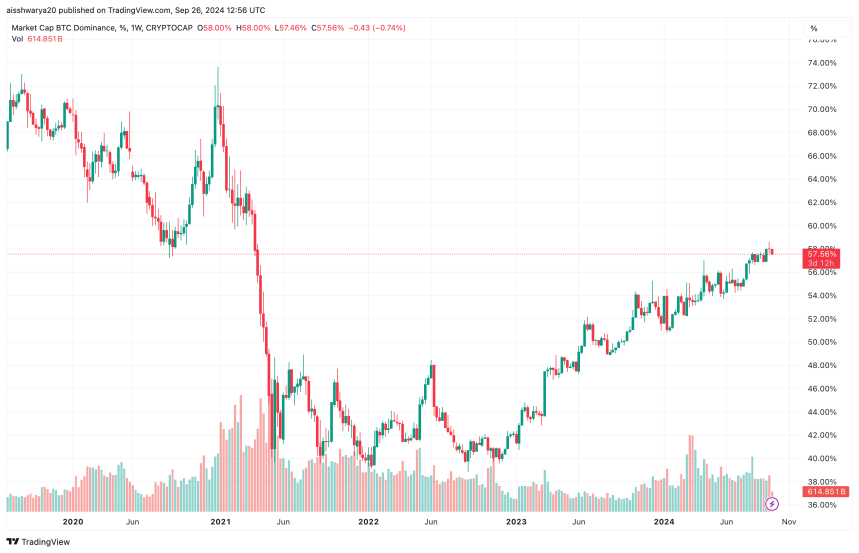
Currently, Bitcoin dominance sits at 57.5%. From the chart below, it is evident that BTC.D has been on a sustained upward trajectory since at least November 2022. According to crypto analyst Yoddha, BTC.D looks poised to crash into the mid-40s, potentially paving the way for a full-blown altseason.
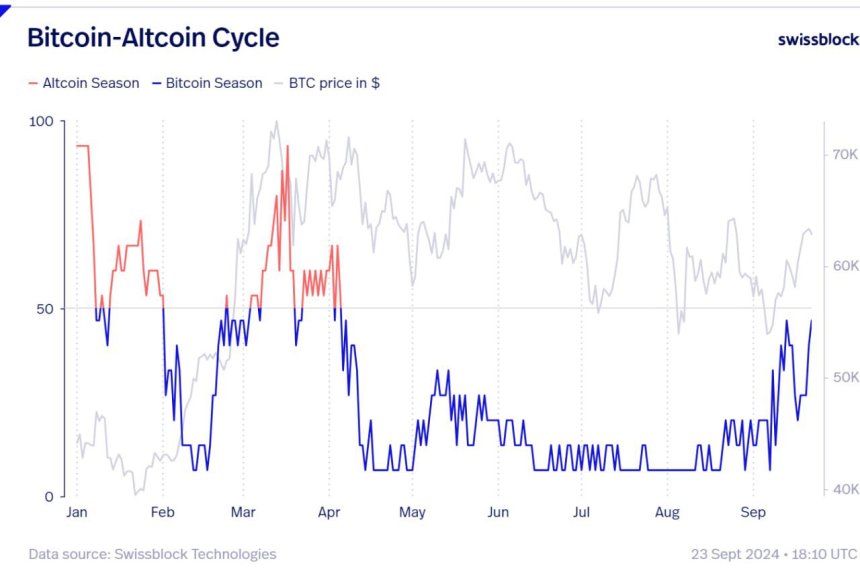
Negentropic, co-founder at on-chain data platform Glassnode, remarked that the market seems to be on the verge of an altcoin season. Referring to the Bitcoin-Altcoin Cycle chart from Swissblock, Negentropic notes that once BTC breaks its all-time high (ATH) and enters price discovery mode, altcoin should follow suit.
The Bitcoin-Altcoin Cycle chart displays the inverse relationship between BTC and altcoin price movements throughout the year. Any reading above 50 indicates the market has entered an altcoin-dominated phase, whereas a reading below 50 signals a BTC-led market.
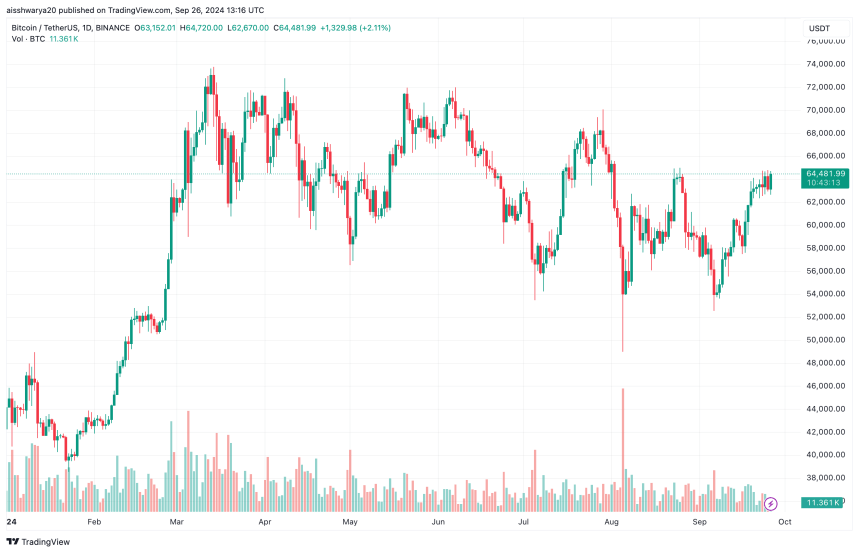
Despite these promising indicators, it’s important for the leading altcoin, ETH, to rebound against BTC before capital flows into mid-cap and small-cap altcoins. As previously reported, the ETH/BTC trading pair is currently at its lowest since April 2021. At press time, BTC trades at $64,481, up 1.5% in the past 24 hours.
What's Your Reaction?